

The UCLA Hollywood Diversity Report Doesn’t Prove What It Claims
How a $1.75 million study measures diversity — and why it doesn't work.


The number one film among Latinos last year had zero Latino leads.
That’s according to UCLA’s 2026 Hollywood Diversity Report. The Conjuring: Last Rites had all-white leads. Their data also says its opening weekend audience was 40 percent Latino — the largest of any film in the study.

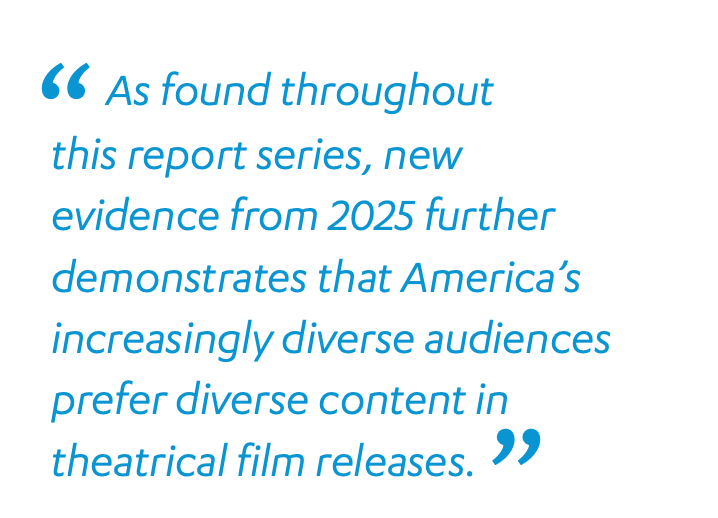
That simple statistic directly contradicts the study’s headline thesis, that America’s increasingly diverse audiences prefer diverse content:
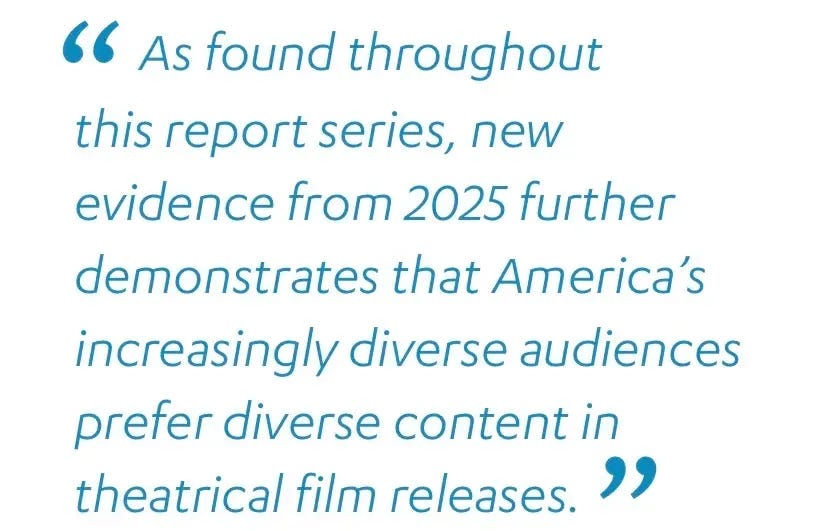
But this strange study provides little evidence for this conclusion. As we just saw, it often provides the opposite. Another example:
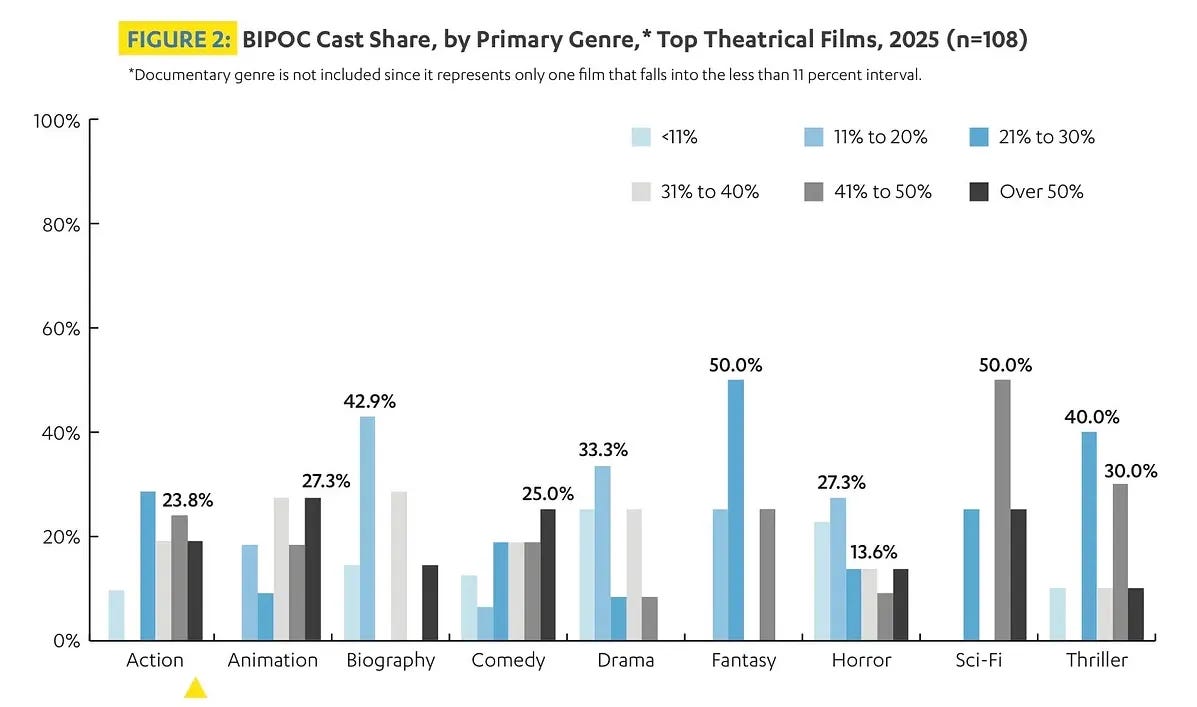
According to the study's own Table 5 (p. 43), horror draws both the highest Black (15.7%) and Latinx audience share (29.1%), while also posting the lowest white share (46.5%). Per Table 1, horror has the highest ROI in the report (2.6) — but Figure 2 shows 63.6% of horror films have casts that are 30% BIPOC or less, the third least diverse of any genre with an actual cast, after fantasy and drama.
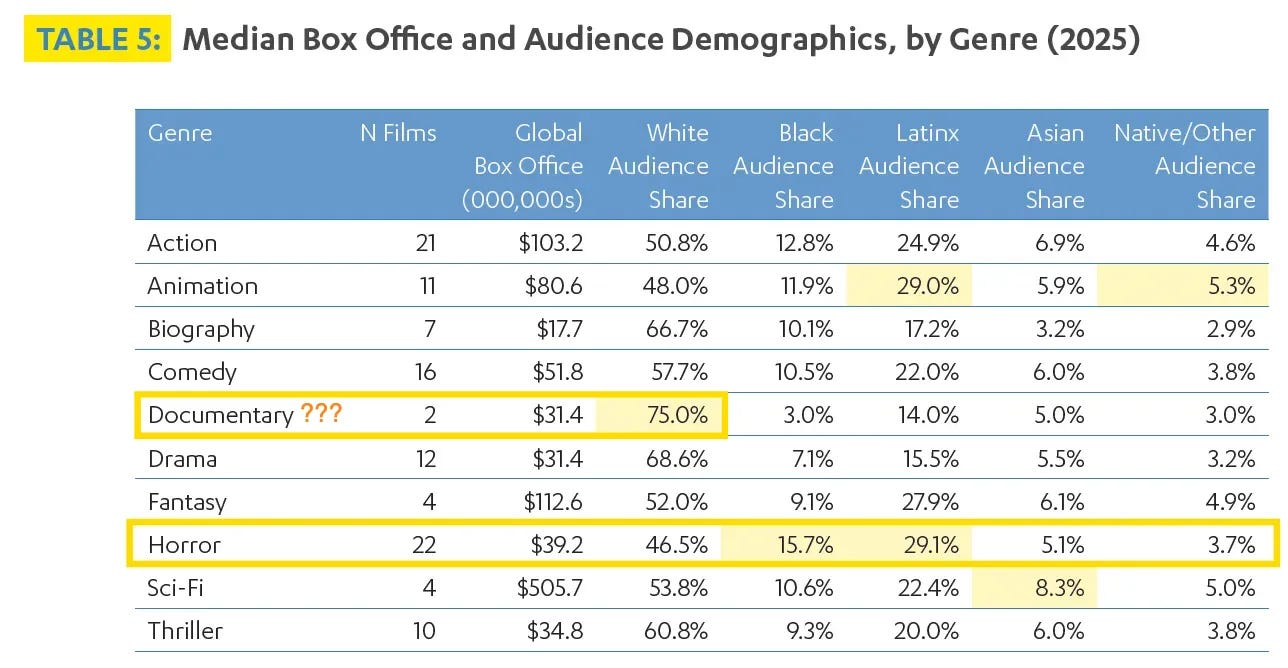
Doesn’t this directly contradict the headline finding that “increasingly diverse audiences prefer diverse content in theatrical film releases?”
And that’s just the beginning.
This essay dissects the myriad problems that plague the UCLA study.
This matters, because if we actually want more diversity in Hollywood, we absolutely need better research. Otherwise we will be stuck in what I called the Annenberg Ouroboros, using bad data to fuel outrage without promoting real change.
And the reality is that UCLA’s methodology is simply too weak to justify many of its most basic conclusions.
Introduction

UCLA’s bi-annual report is coauthored by Dr. Ana-Christina Ramón, the inaugural Director of the Entertainment and Media Research Initiative (EMRI), and Dr. Darnell Hunt, UCLA’s executive vice chancellor and provost.

Part 1 of the 2026 report examines 109 of the top English-language, theatrical film releases in 2025. Part 2 focuses on streaming.
The report defines itself as a study of the relationship between diversity and the bottom line in theatrical films and television, and seeks to prove that diverse films earn more money.
It makes this argument in two parts. The first, the more effective section, measures the (lack of) diversity among Hollywood creatives, specifically Cast, Directors, and Screenwriters. Afterwards, the “Bottom Line” section argues that diverse audiences prefer diverse films, which drives ticket sales, and thus justifies more diversity in front of and behind the camera.
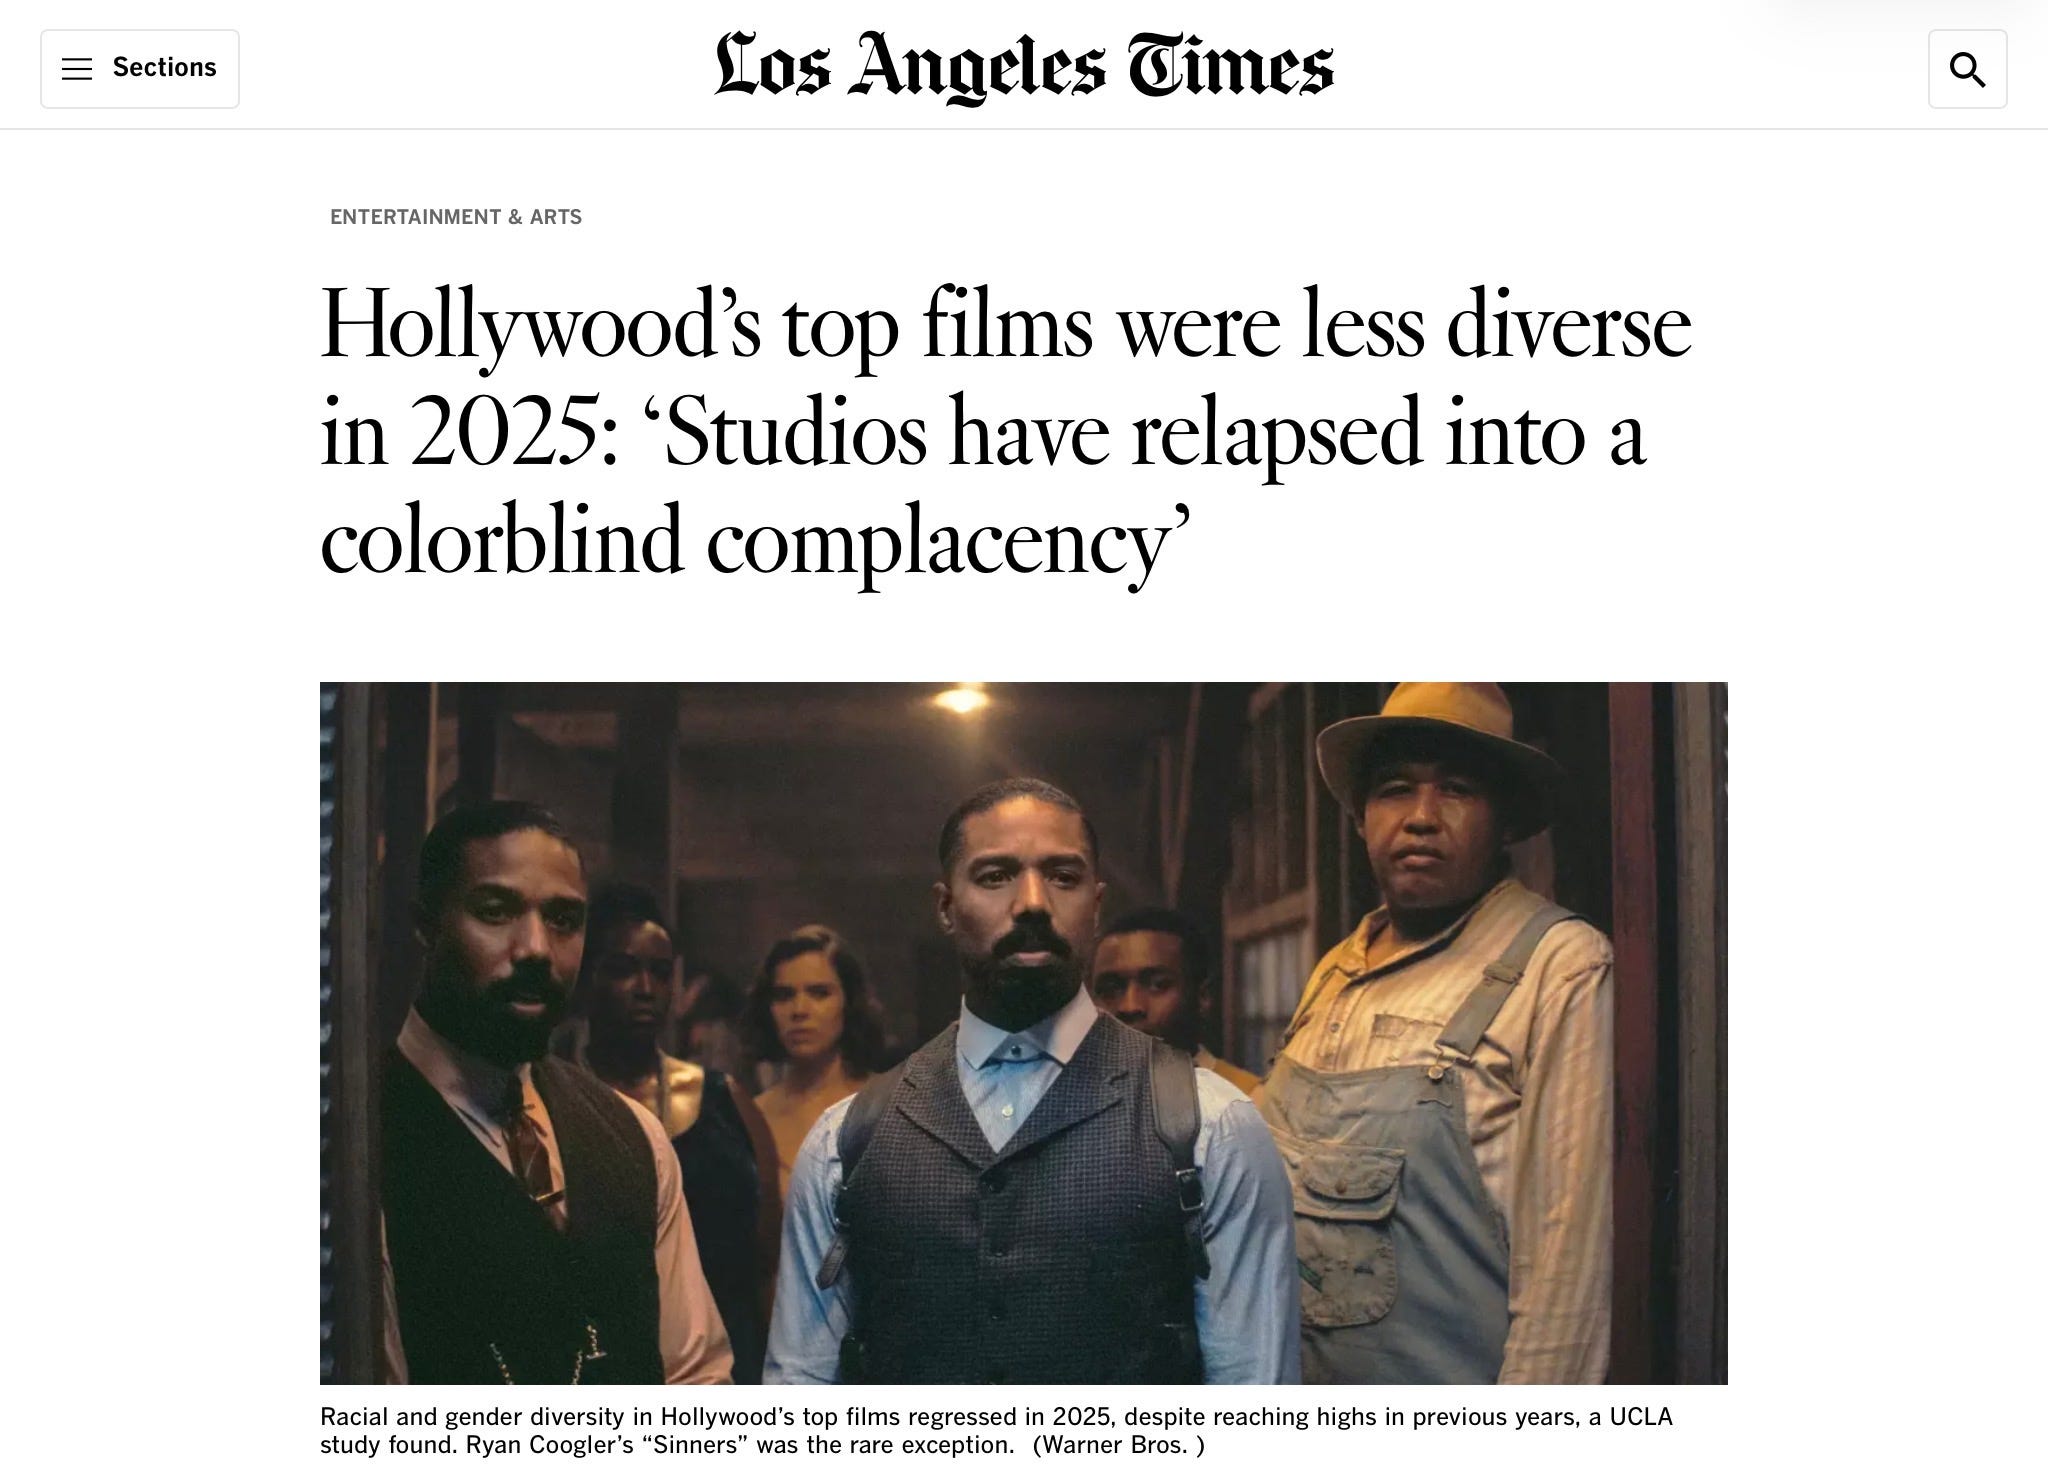
Like USC’s Annenberg Inclusion Study, UCLA’s Hollywood Diversity Report makes the rounds of the trades every year. This year’s study appeared in Variety, Forbes, the Hollywood Reporter, and the LA Times:
A Well-Funded Study
The UCLA Report has received substantial, highly-publicized funding this decade:
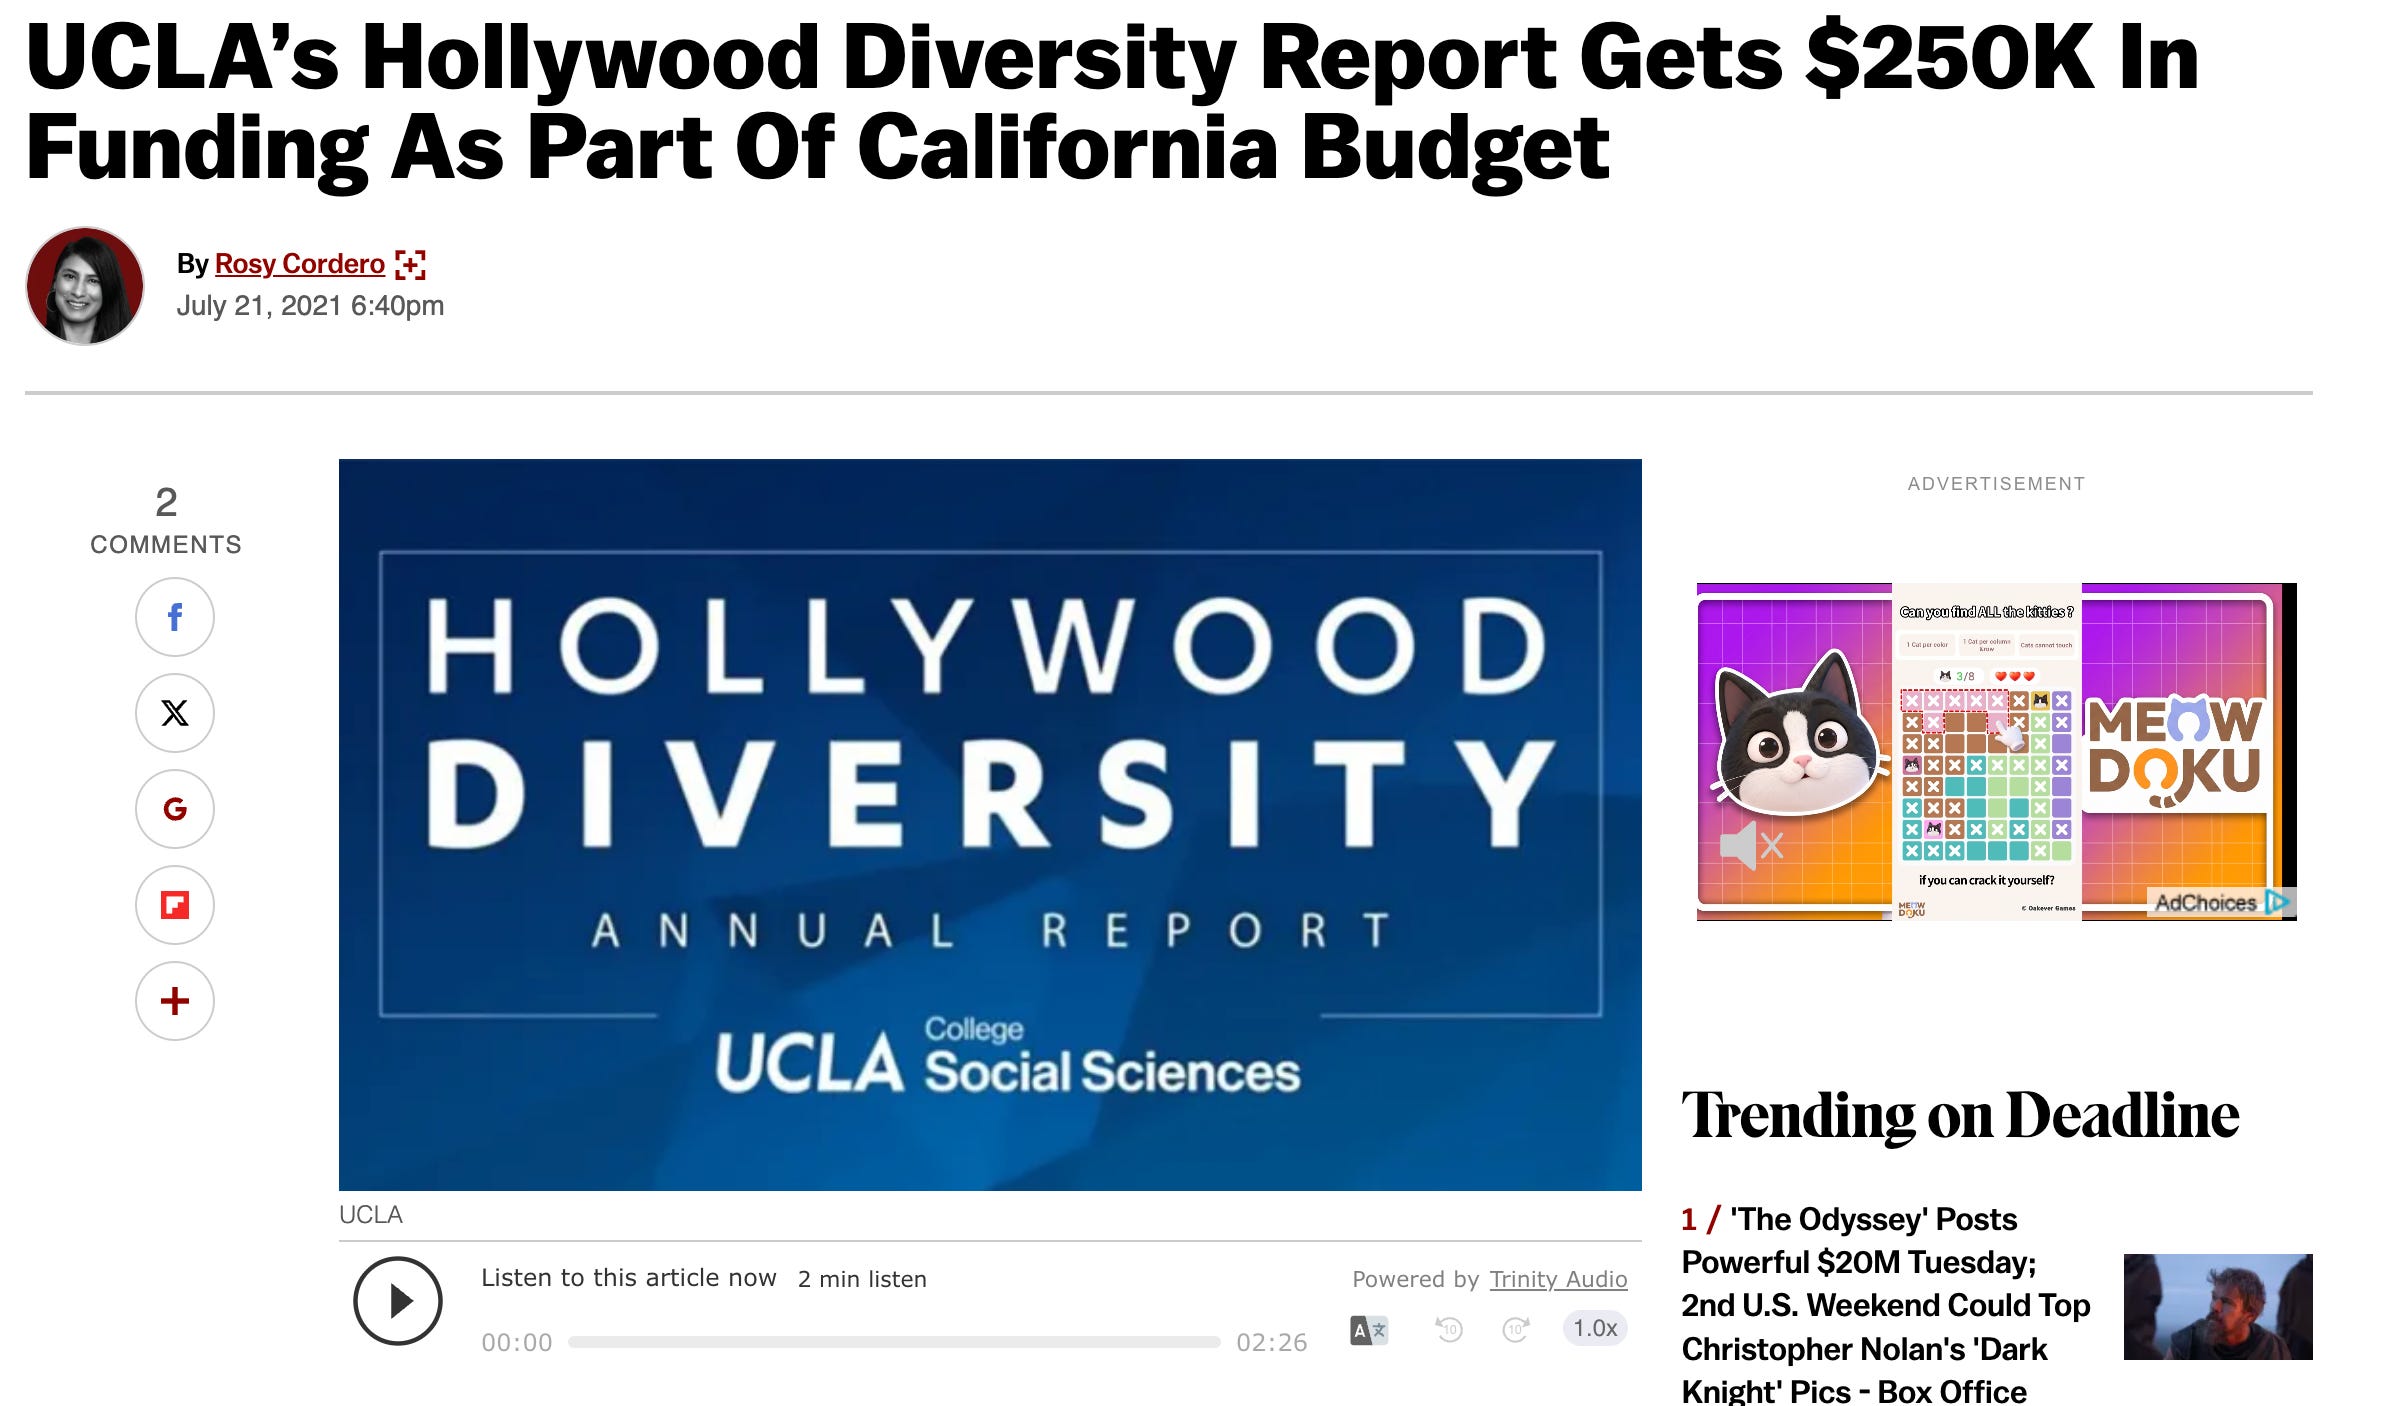
In 2021, it received $250k in funding from the California budget.
In 2022, state lawmakers invested another $1.5m in the study.
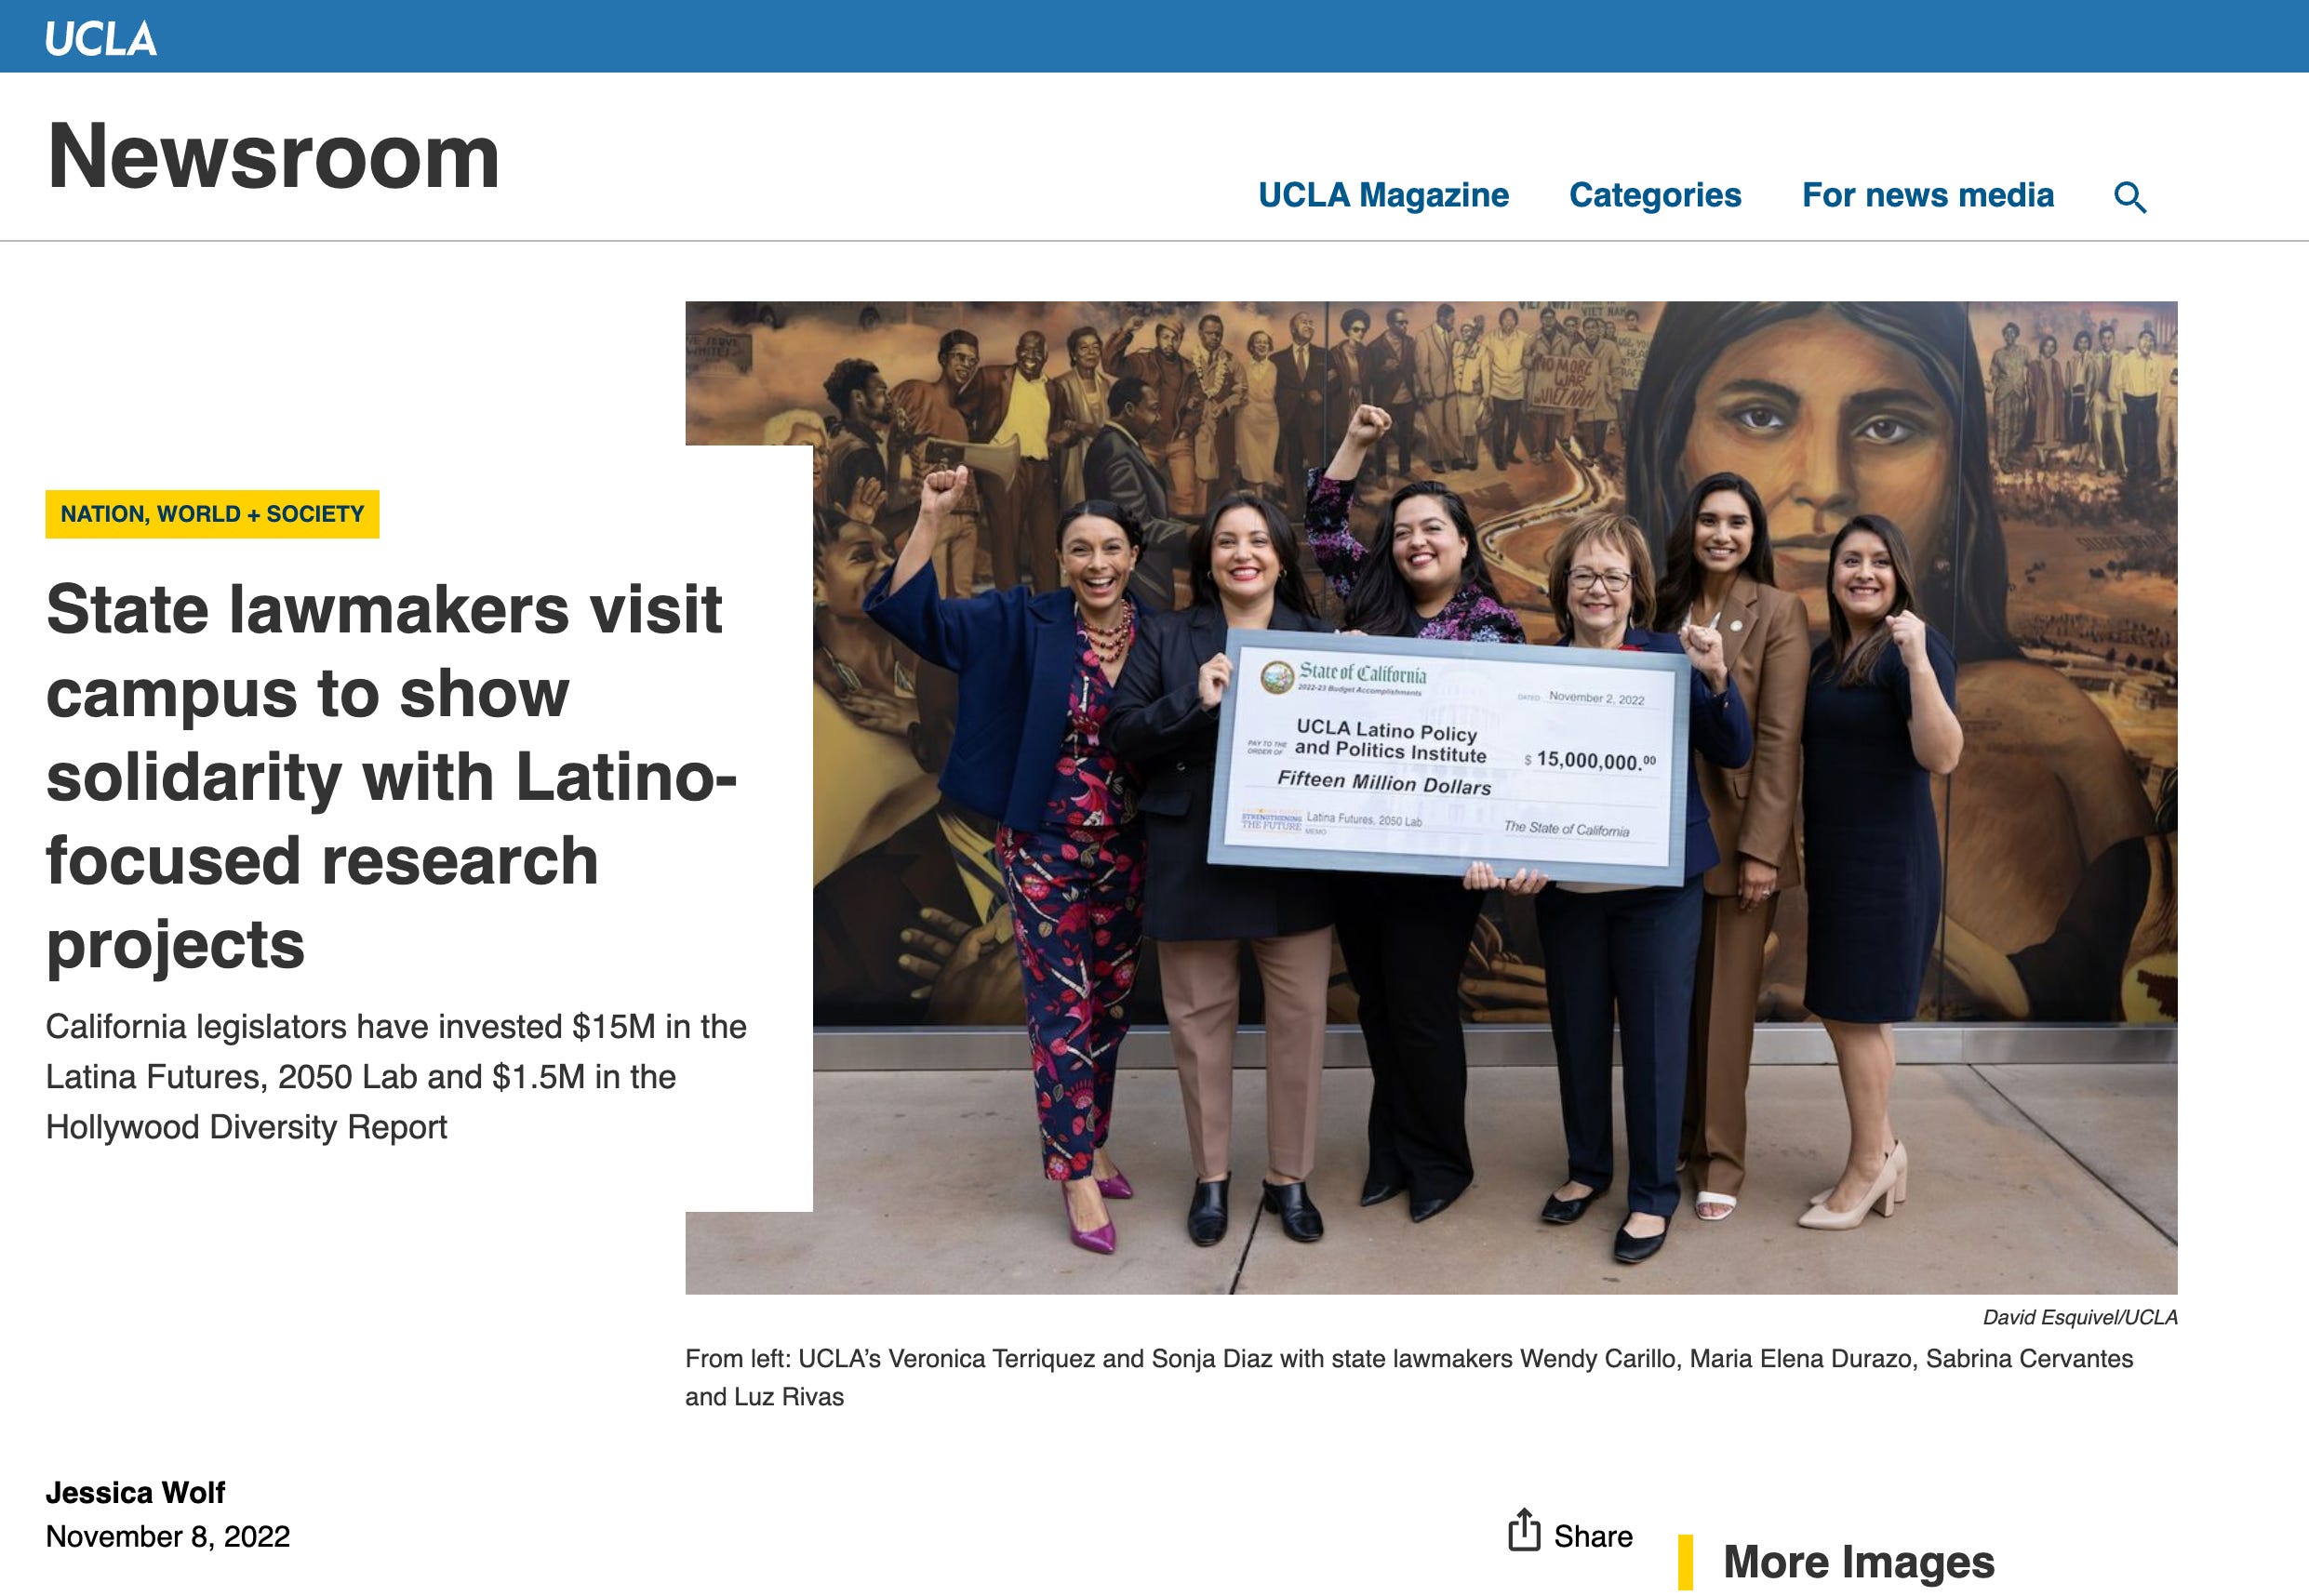
This is in addition to several corporate sponsors, whose contributions appear on the acknowledgements page, but whose contribution amounts are never disclosed.
Over the years, Netflix, Hulu, Disney, NBCUniversal, and Starz have all sponsored this report, which grades their casting and hiring decisions. This is an obvious conflict of interest; UCLA is directly measuring the products of their own sponsors.
Another conflict of interest: the Latino Film Institute, the report’s Leadership Sponsor, lists the report’s co-author as the Vice President of its board of directors, and previously awarded her $100,000 as its inaugural scholar. The report discloses the sponsorship. It does not disclose the board seat.

It’s also worth noting that there are three additional credited graduate coauthors, and four additional data collectors. Nine people worked on this study, with significant funding, which should be more than enough for proper data collection.
Numbers Don’t Lie
In the 2021 press release for the $250k grant from the state of California, Local Assemblywoman Wendy Carrillo (AD 51-Los Angeles) had a choice quote:
“Numbers don’t lie,” Carrillo said. “The Hollywood Diversity Report holds the data needed to effect change for both below and above-the-line workers, which is why it was critical to leverage our state’s budget to support it.”
But the numbers do lie. Whether this is intentional is obviously debatable, but the study has serious issues, ones so large as to invalidate its own headline findings.
So what did the state’s $1.75 million actually buy it?
Before getting into my substantial critique, let me acknowledge what UCLA does well. The report assembles a large amount of data on diverse employment in Hollywood, which is valuable. Its box office and audience data are also genuinely useful.
My concern isn’t that UCLA studies diversity. It’s that it has a flawed methodology, and reaches unsubstantiated conclusions, which people then repeat as if they were true.
The biggest single problem emerges in “The Bottom Line” section, where they try to argue that diversity causes financial success. This may be the case, but the study in its current form certainly does not prove it.
As I will discuss, there are five serious problems with UCLA’s approach:
an arbitrary definition of “diverse cast,”
confusion in how the study defines and counts a lead role,
significant causal claims the data does not support,
failure to control for obvious confounding variables such as theater count, budget, franchise status,
and headline conclusions that don’t match the study’s own results.
So let’s get into it.
A Strange Range: UCLA’s Underlying Methodology
Before you can argue that diverse casts make money, you have to define what a diverse cast is. UCLA’s answer is that you take the top eight credited actors in a film, count how many of them are BIPOC, then sort the film into one of six buckets.
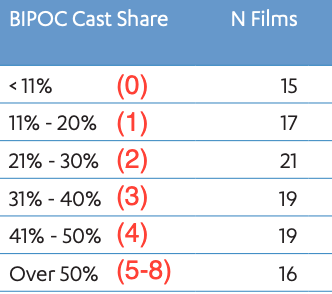
Here’s how they define the buckets:
0 lead roles = <11% BIPOC
1 lead role = 11% to 20% BIPOC
2 lead roles = 21% to 30% BIPOC
3 lead roles = 31% to 40% BIPOC
4 lead roles = 41% to 50% BIPOC
5-8 lead roles = Over 50% BIPOC
That’s their entire measurement process. Look at how strange this is: “less than 11% BIPOC” reads like a small share, but it actually means zero.
Fifteen of the 109 films UCLA examined in 2025 had all-white leads, which they label as less than 11%, as in this table (author’s translation of the actual numbers in red).
With eight slots, the actual possible percentage values are 0, 12.5, 25, 37.5, 50, 62.5, 75, 87.5 and 100. But instead of using those actual numbers, UCLA collapses them all into these strange ranges. Also, for some reason, instead of actually measuring the top four categories, which would be valuable, UCLA collapses them into one “Over 50%” bucket.
So “41 to 50 percent BIPOC” doesn’t mean that percentage range at all — it actually means four top-billed BIPOC actors.
Almost always. Bear with me here. A meaningful share of films don’t have eight leads, the study actually puts the average at 7.2. So in a seven-lead film, 3 actors means 42.9%, which means that the 41 to 50% category can mean either three or four BIPOC actors. The bins don’t even mean something consistent across movies. And they of course don’t tell you which films are which.
Choosing eight leads (occasionally seven) to focus on is completely arbitrary, especially when applied to 109 different films.
There are many obviously better ways to measure actual lead roles, including…
speaking time
screen time
But this is not what UCLA does. The report never explains why eight credited actors is better than five, ten, all speaking roles, or any other measure of cast diversity. This is problematic, because if they had chosen…
top five leads
top six leads
top ten
weighted billing
How many of their headline findings would change? We don’t know. And they don’t do the work to find out, leaving their findings remarkably fragile.
Another oddity this produces: a film with five BIPOC leads counts the same as one with eight. Why? They don’t say!
But this calls the entire study into question, and substantially limits the interpretability of the findings, especially the key one they highlight on page 3 of the study:
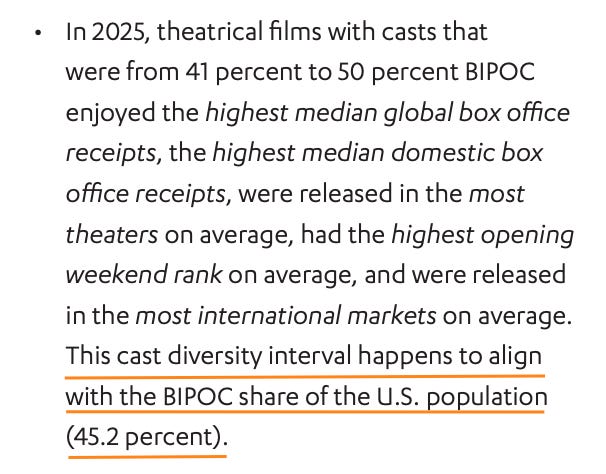
Once you understand the methodology they chose, the whole thing becomes painfully clear: the report began with the hypothesis that films reflecting U.S. demographics should perform better commercially, then sought to prove that claim.
But the 45.2% "coincidental alignment" is basically numerology, a religious belief in the significance of certain numbers.
The study has six bins, one of which wins every year.
And the study simply retrofits the significance every year onto whatever bucket wins.
UCLA’s “Bottom Line” is Random
I looked into every box office report from 2011-2025. Here’s a chart of the study’s “winning BIPOC percentage,” tracked alongside the growth in the BIPOC Population, based on UCLA’s own stated numbers.
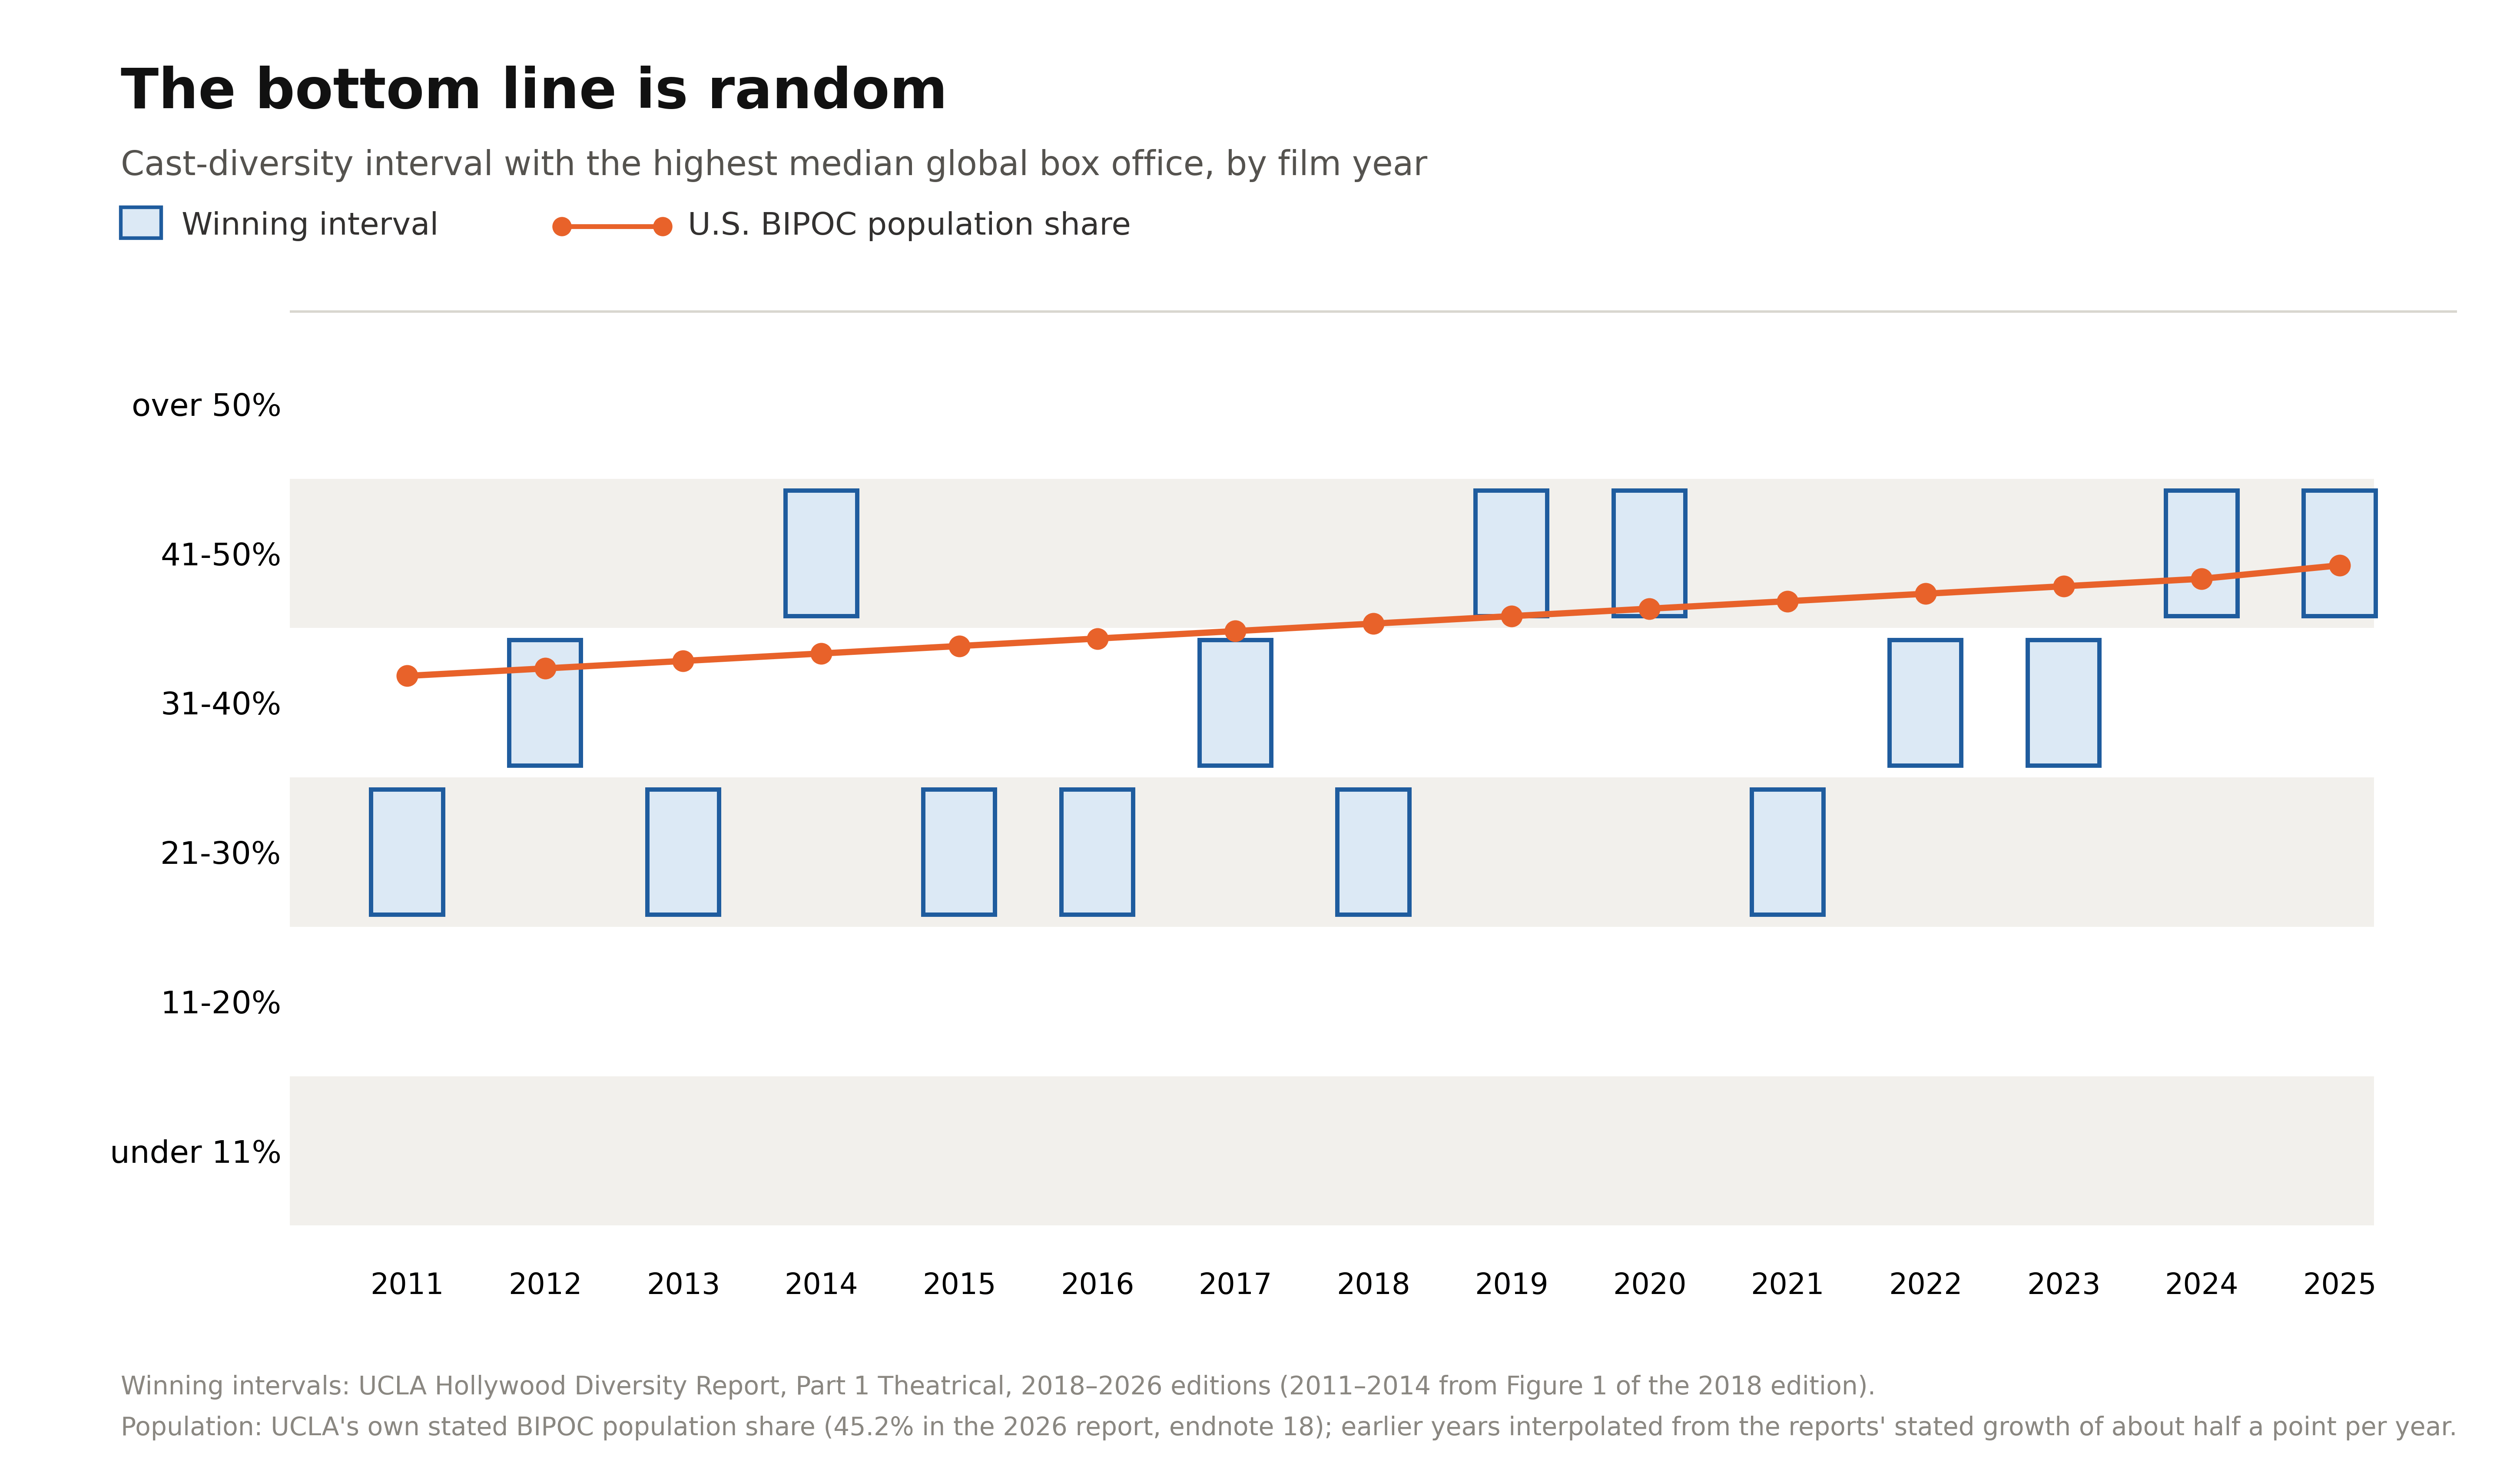
It’s completely random, with no correlation to the actual BIPOC percentage of the population. It lands on the population benchmark number about as often as chance would predict. Here are the numbers listed in the studies:
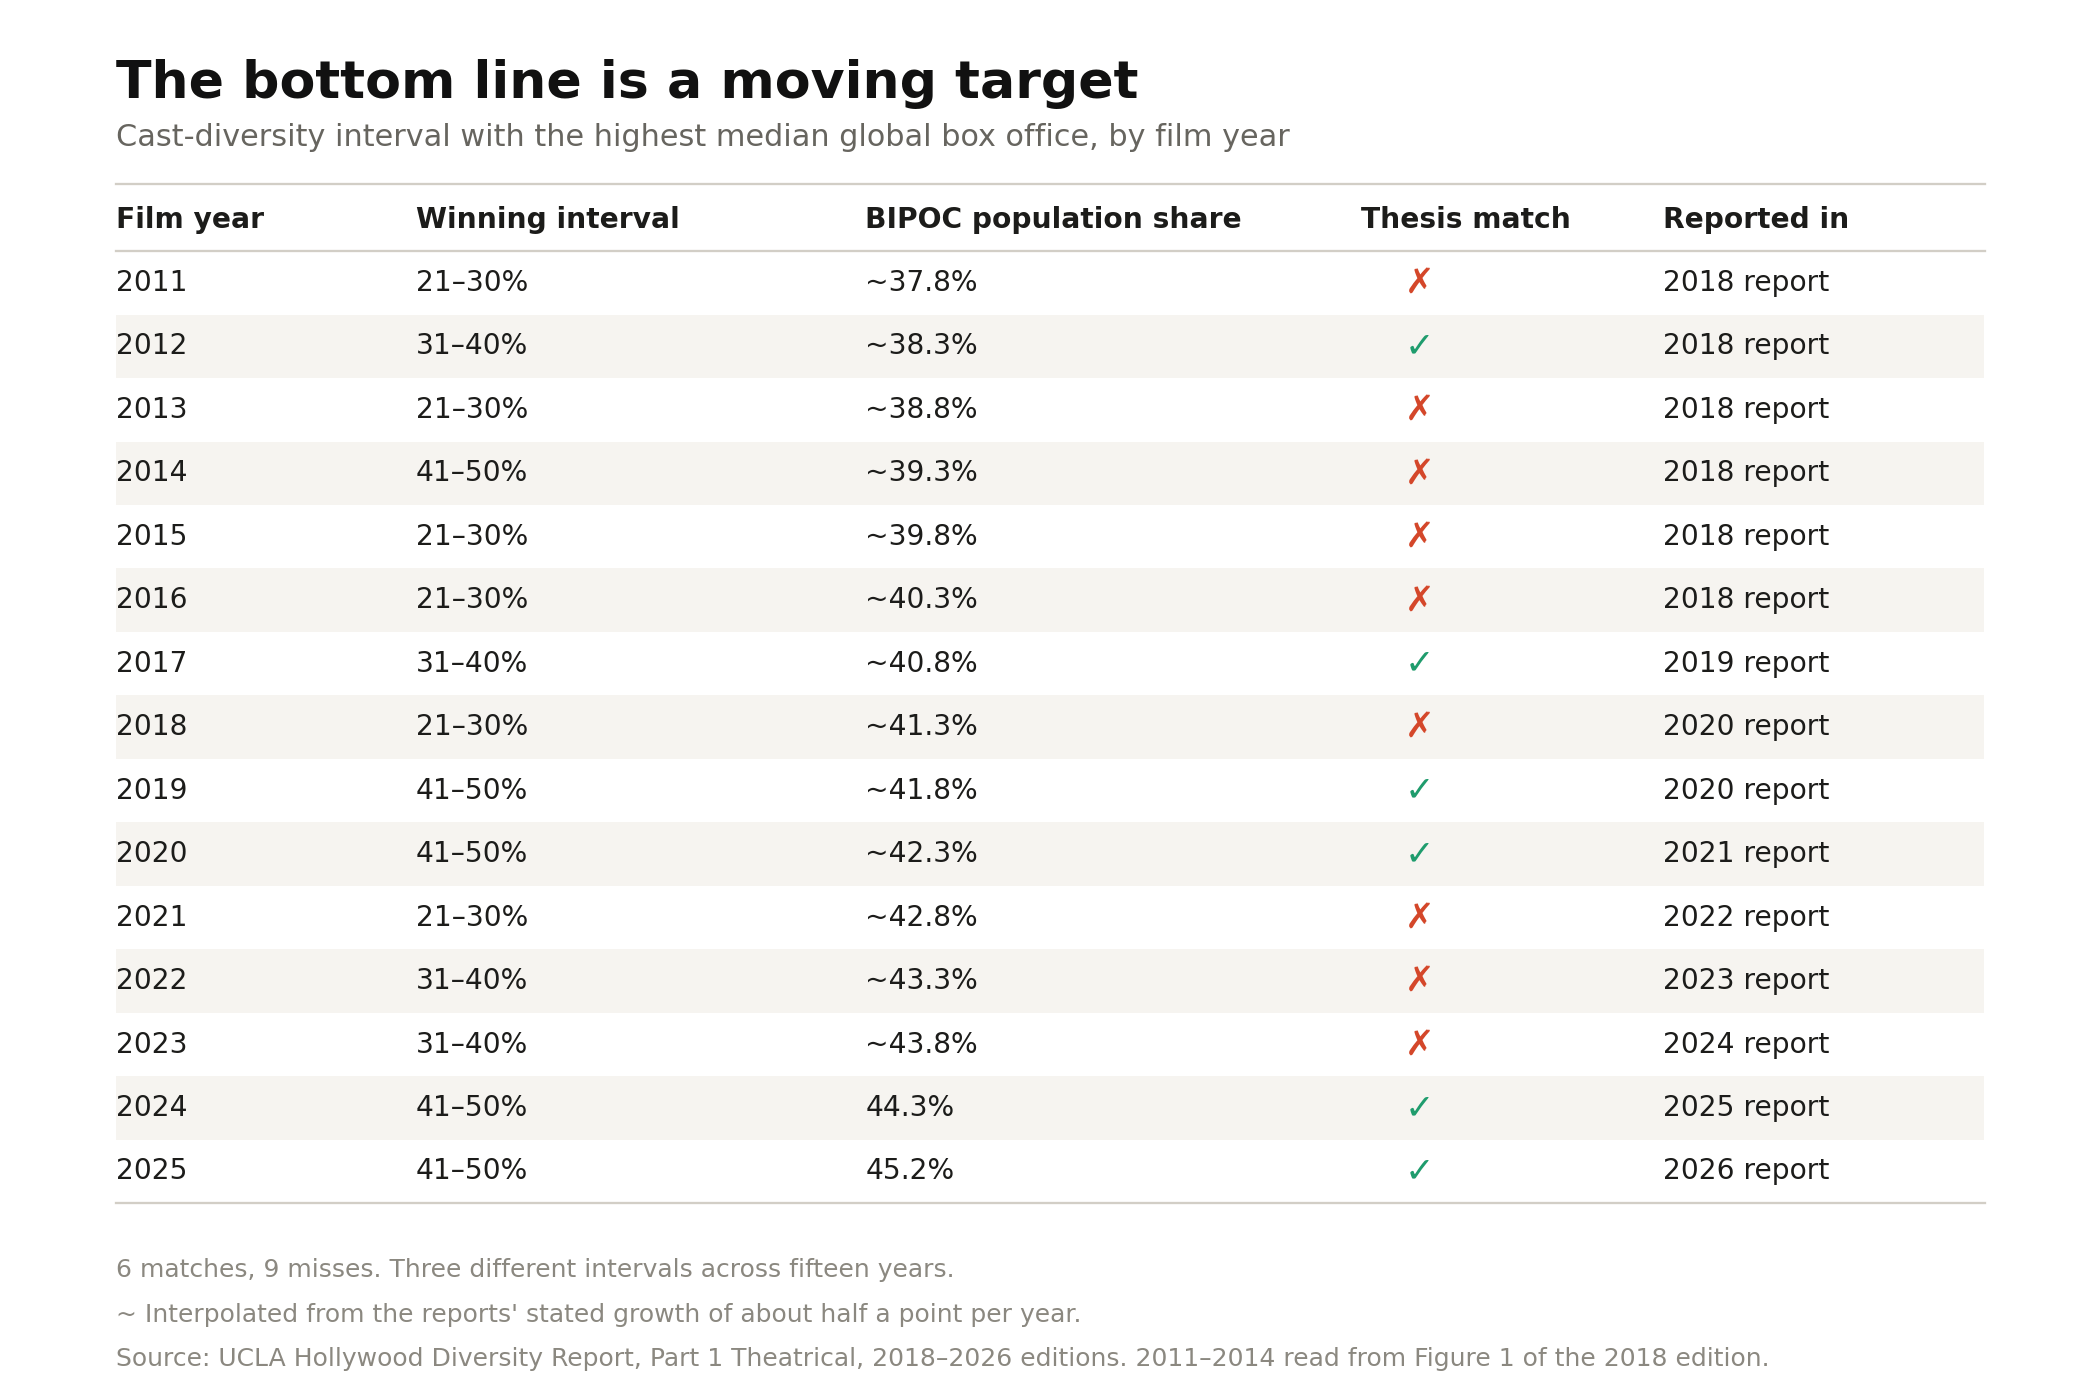
Across 15 years of reports, the supposedly optimal diverse percentage wanders from year to year with no consistent relationship to the demographic benchmark, US BIPOC population, UCLA claims it reflects.
The headline finding was correct in six of fifteen years, just 40%. But only three of six bins ever actually win: 21–30%, 31–40%, and 41–50%. Guessing blindly among those three would be right about a third of the time. UCLA's benchmark does barely better than that.
Not that they ever admit that; they simply report the winning bin each year, and never note that the number moved. Look at this headline “Bottom Line” finding from the 2018 study:
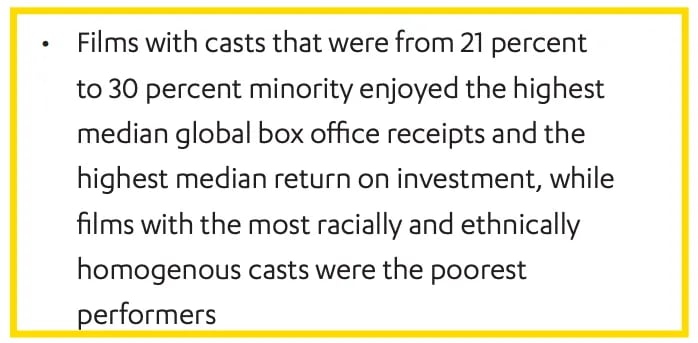
The 2018 report announced 21-30% as the sweet spot for diversity.
Let’s look at 2022:
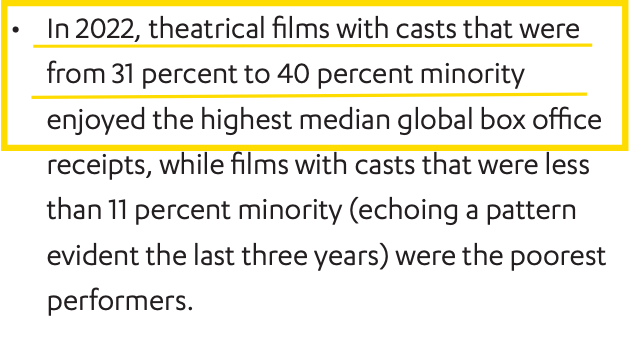
This time the sweet spot is 31%-40% BIPOC. Now let’s look at 2026:
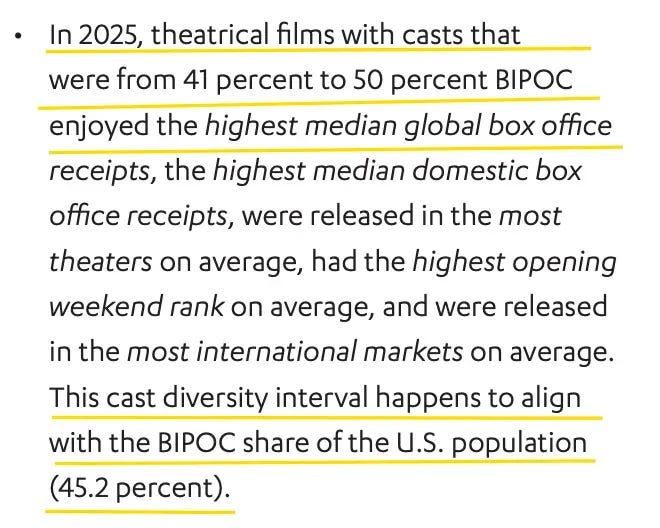
The 2026 report now has it at 41-50%.
The headline finding is simply fitted retrospectively to whatever that year’s data show. It doesn’t predict or demonstrate anything.
As Nassim Taleb would say, it’s Fooled by Randomness.
Another term for it: numerology.
There is also no stable curve in UCLA’s data showing more diversity leads to more ROI, and the study’s own conclusions even show that, this year, the 21–30% diverse films beat the 41–50% ones.
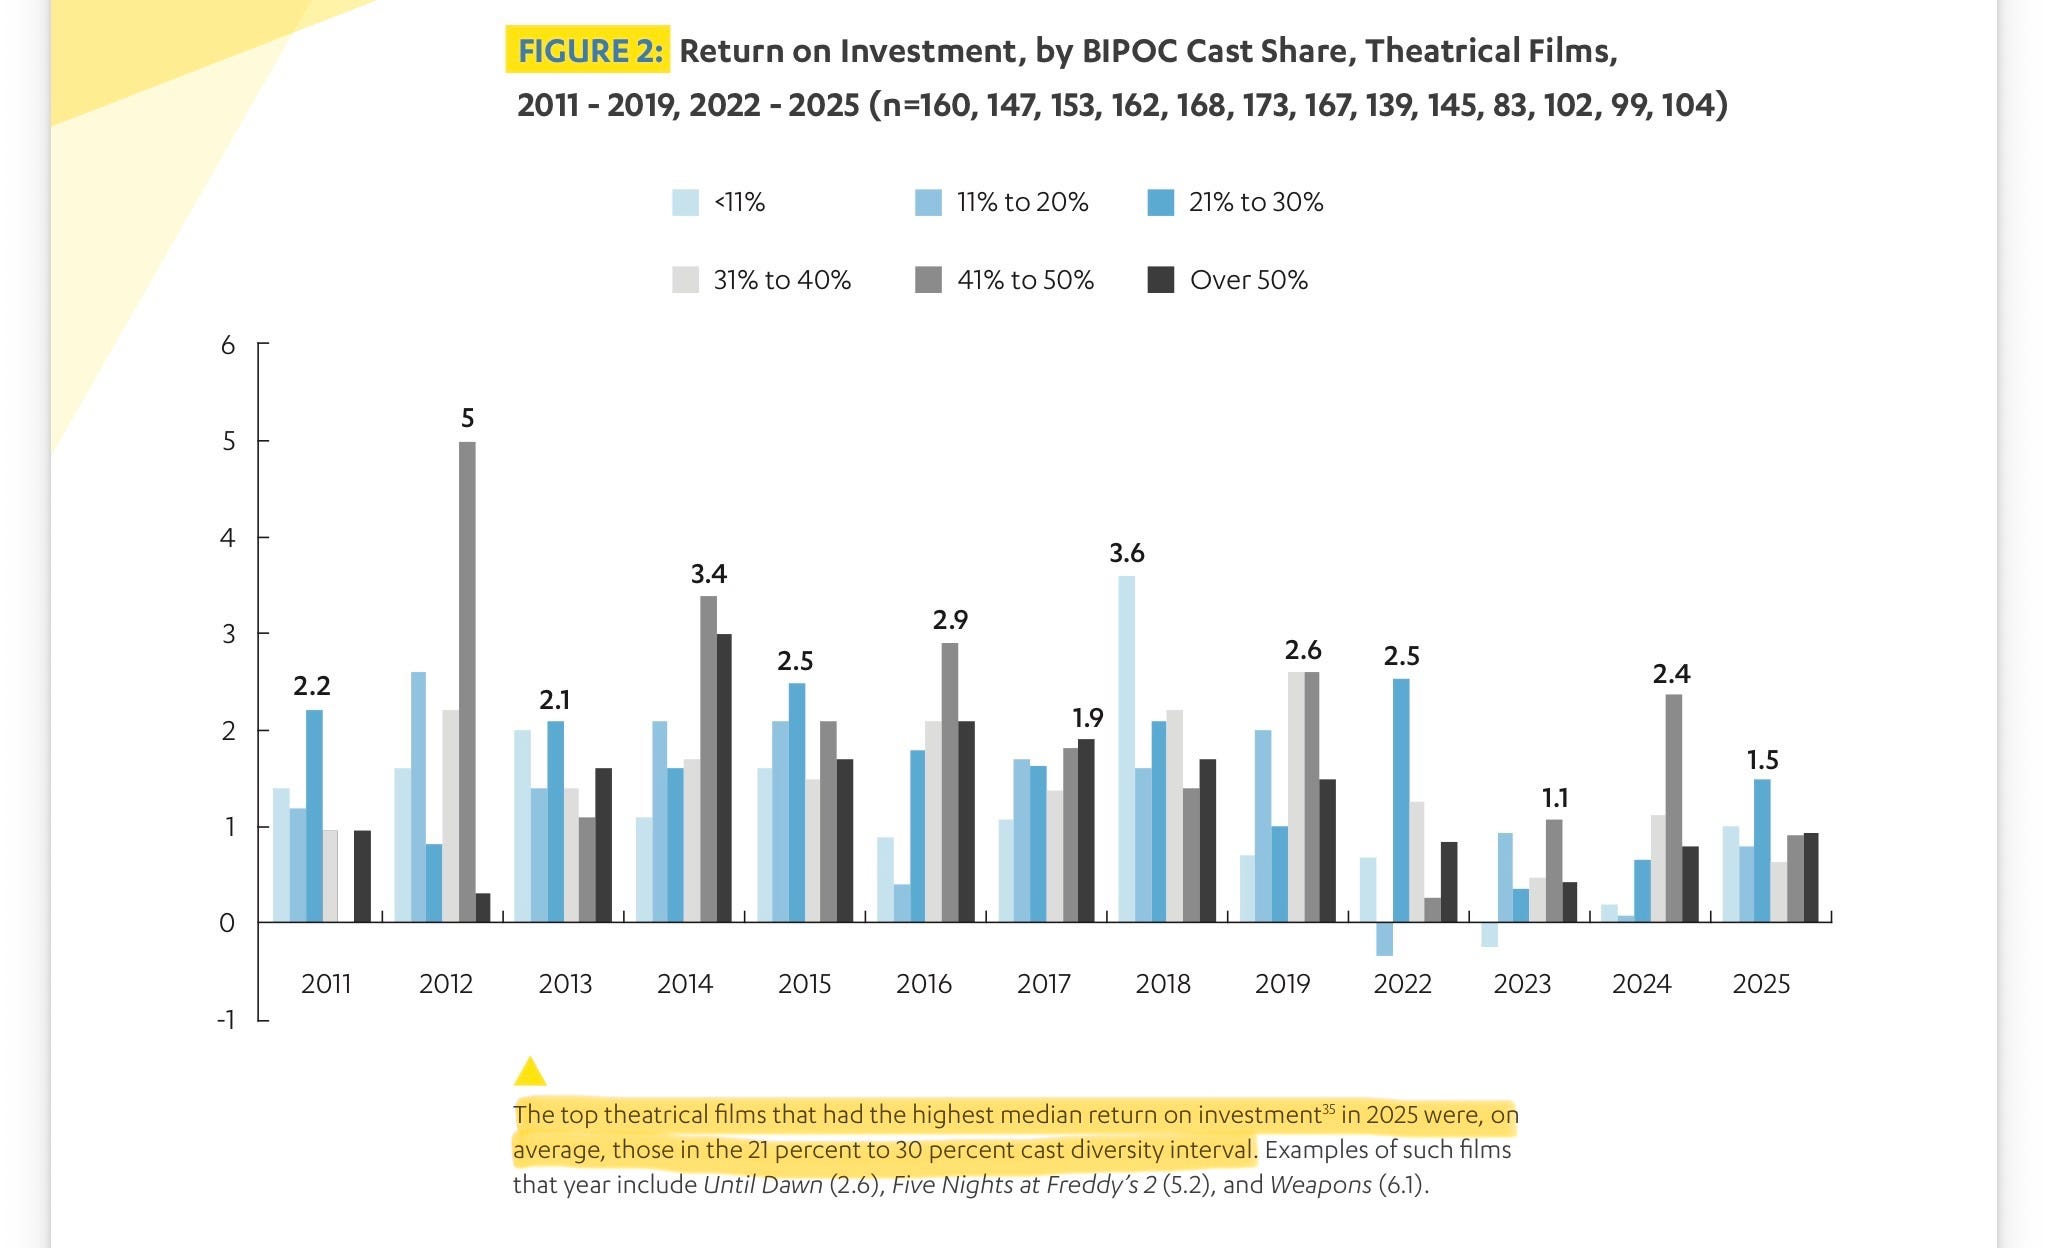
Do you see a discernible pattern here? Where when diversity goes up, ROI goes up?
No, you can’t. And it gets worse: in six of the years they measured: 2011, 2013, 2015, 2018, 2022, and 2025, the highest ROI films are films that are less diverse than 2025’s headline finding. In 2017, the most diverse films won, surpassing their 41-50% thesis. The next year, 2018, the least diverse films won.
That means that in seven of thirteen years — over half of the years they measured, excluding 2020 and 2021 — the effect they claim did not happen. In other words, it’s random.
And within any given year, ROI also doesn’t rise as cast diversity rises. The 41 to 50% bin isn’t the top of a trend, it’s just cherry picked randomness.
The study’s own data fails to support its headline conclusion that more diverse films produce better economic outcomes, on both counts they themselves measure: Box Office and ROI.
Another, far more rigorous study could potentially prove that diversity leads to a higher bottom line, but this one simply doesn’t.
And this is a university that was recently ranked number 11 in the world by US News.
What is a Lead?
UCLA distinguishes between two types of parts: leads and what they confusingly call “All Roles.”
The study defines a “lead role” as “the first credited actor and/or top-billed actor in a film.” One per film. No co-leads.
They define “All Roles,” confusingly, as “this report considers only the top eight actors in each film, in order of appearance in the credits.”
These categories are reflected in two pie charts in the study. One describes 108 lead actors (it doesn’t explain where the missing lead went).
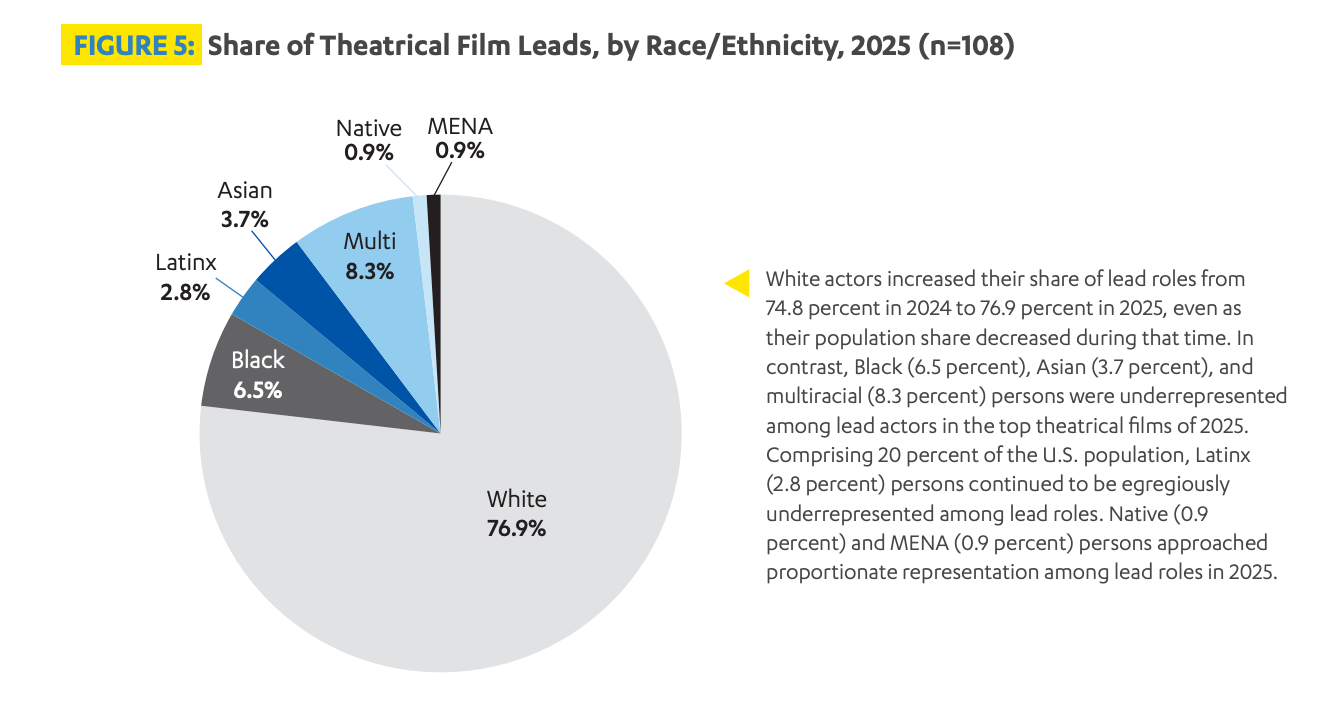
The other describes 773 “All Theatrical Film Roles,” which, as per their footnote, actually only measures the top eight billed cast.
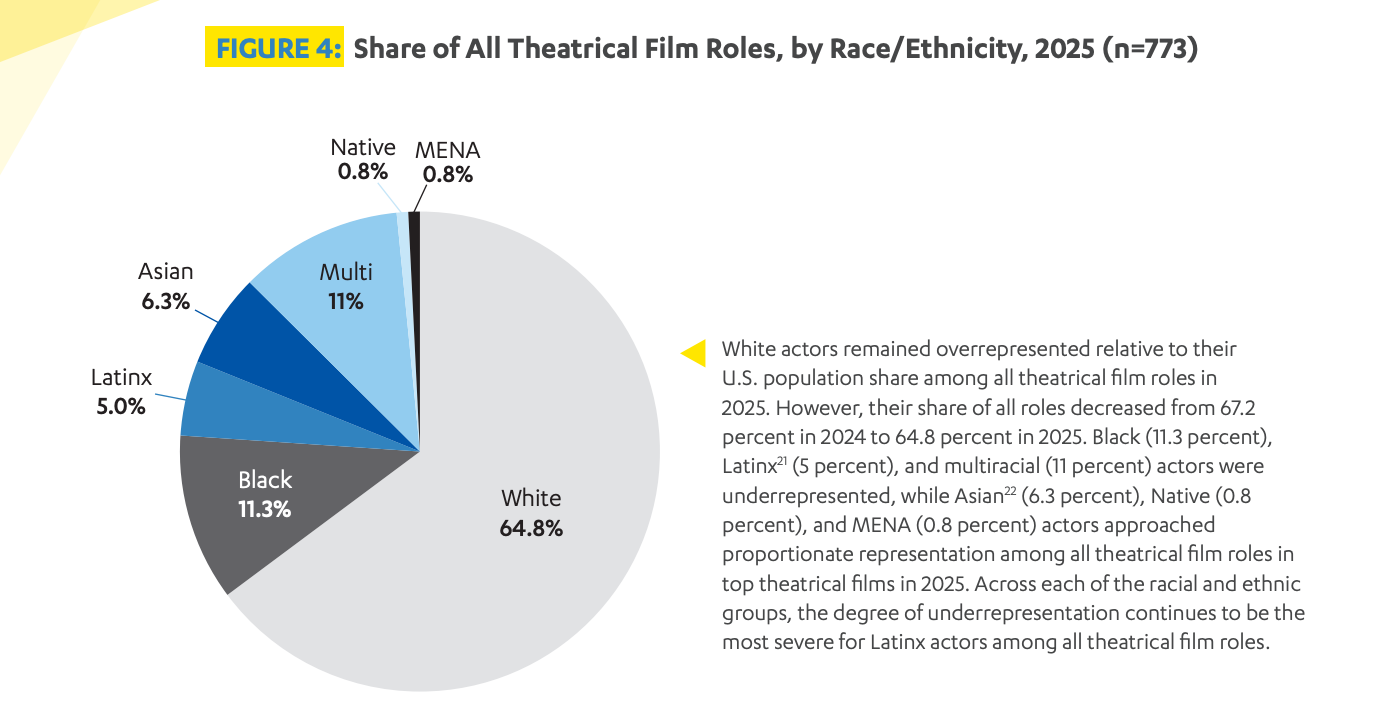
The two charts aren’t independent. The 773 includes the 108 — every first-billed actor is counted twice: once as the lead and again as one of eight “All Theatrical Film Roles”. This means the second chart can’t be read as a clear indicator of overall supporting cast diversity, because the stars are still included in it.
It took your humble Gadfly quite a bit of time to figure this out, because nowhere in the study do they mention this. I discovered it by taking the average number of roles they cite, 7.2, then comparing it to the “all roles” category.
This also means that the data from the second chart is skewed by the data from the first, dragging it towards white. If we remove the leads from the overall roles, the white share of all non-lead roles falls by 2%, and the other groups rise by about a half a percent.
Only using one lead role based on top billing skews the data in strange ways, because it arbitrarily splits ensemble casts.

As an example, let’s use Avatar: Fire and Ash, which UCLA names as one of its highest grossing diverse films. While Sam Worthington is credited first, Zoe Saldaña, an Afro-Latina actress, is clearly a co-lead, billed second. But under UCLA’s definition, Avatar counts as having only a single white lead.
They use this “one lead” system to prove a lack of representation among Hollywood leads. But they also use it another way.
Because of how they categorize supporting leads, Saldaña still counts in the “All Actors” category, and thus Avatar, one of the highest grossing franchises of all time, also lands in the headline 41–50% BIPOC category.
It can thus be cited as evidence that diverse casts make money.
These strange categorizations allow them to have their cake and eat it too: Underrepresentation in leads, overrepresentation in box office.
But it doesn’t reflect reality, or the films themselves. They don’t report the performance of the films by leads, only by “All Roles.” We don’t know why.
Of course since there’s no published dataset, no coding protocol, and no reliability statistic, a skeptical reader can’t actually see how they’re making any of these choices, only infer it.
This is part of a general sloppiness that extends even to basic presentation. In some places the report breaks white actors out by gender without extending the same courtesy to BIPOC actors.
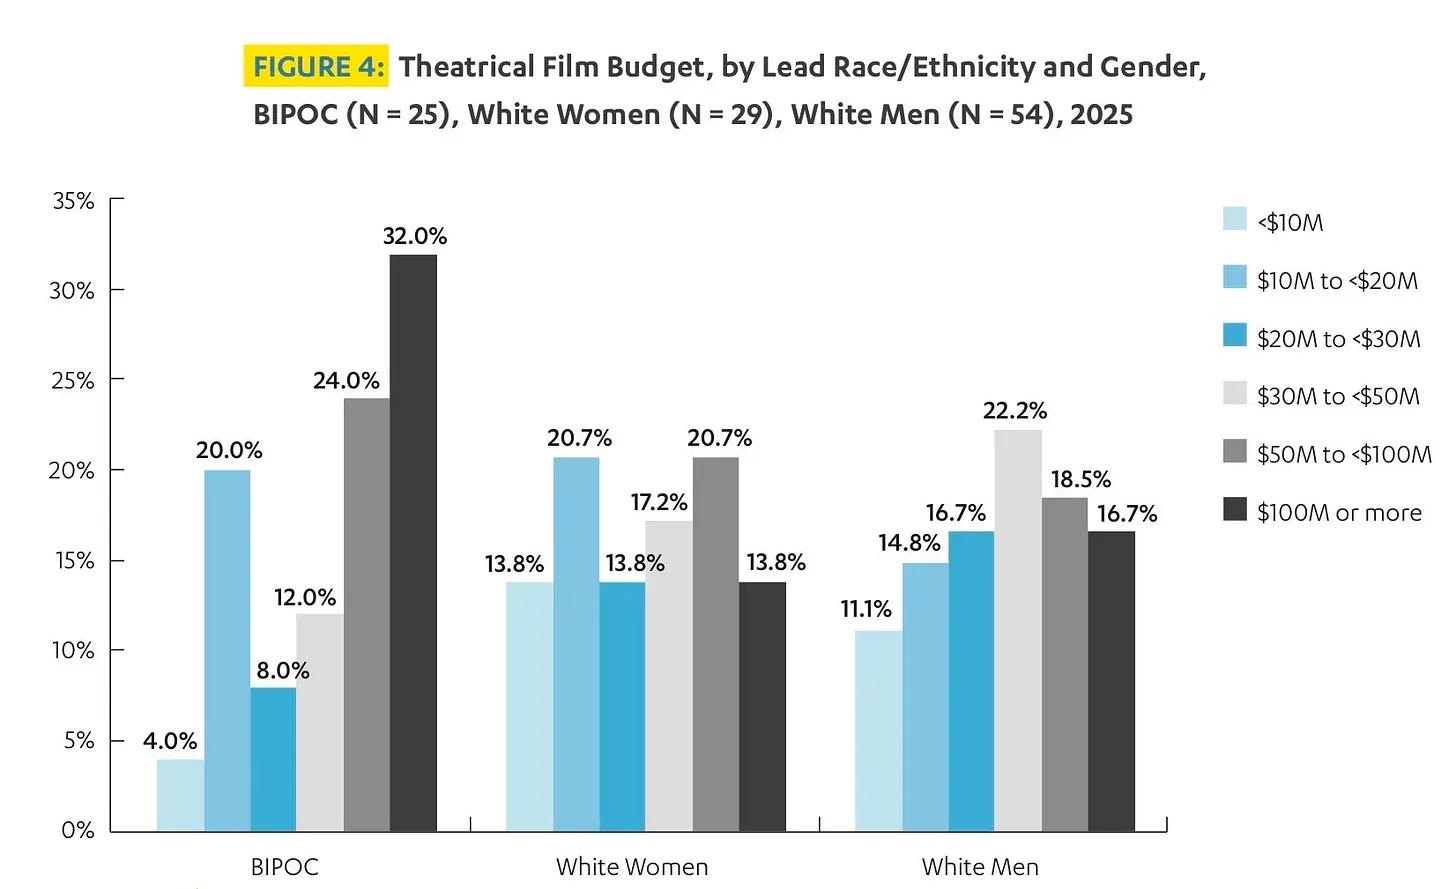
Why? Again, they don’t say.
The Eighth Billed “Lead” Counts as Much as the Star
UCLA’s measure gives every one of the eight lead acting slots in “All Cast” the same weight, which means the eighth-billed actor with four minutes of screen time counts as much as the star who's in every scene.
Take Mission: Impossible – The Final Reckoning, which the study ranks in the 41–50% BIPOC interval. Tom Cruise is the entry in the lead chart. In the “All Roles” chart, he's one of eight, worth 12.5%, the same as anyone else. But we all know that Tom is in the movie way more than the other actors; he’s the lead. Somehow we’re supposed to forget this.
Between this and the confusing, pan-ethnic BIPOC term, the measure can't actually tell you whether audiences are responding to Black leads or whether they're fine with an Asian actor showing up for six minutes in scene 44.

So, if a white movie star is in a movie for 96 minutes, and a Latino supporting actor is in that same movie for twelve minutes, and they’re both billed in the top eight credits, they both count equally for the headline metric.

It’s almost like they just looked at this poster, counted the faces and were like, eight! There we go!
UCLA Draws Inferences the Data Cannot Support
Let’s go back to the headline quote on page three.
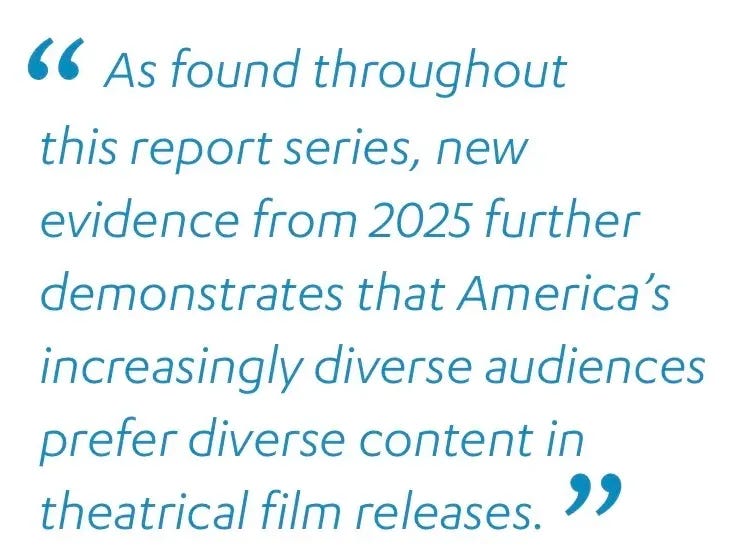
But there is no new evidence in this year’s study, and the evidence they do present, like the Conjuring example above, simply doesn’t prove this. Their evidence currently suggests that Black and Latino audiences prefer genre fare like horror, regardless of whether the leads are white or not. Look at the top three movies for Latinos:
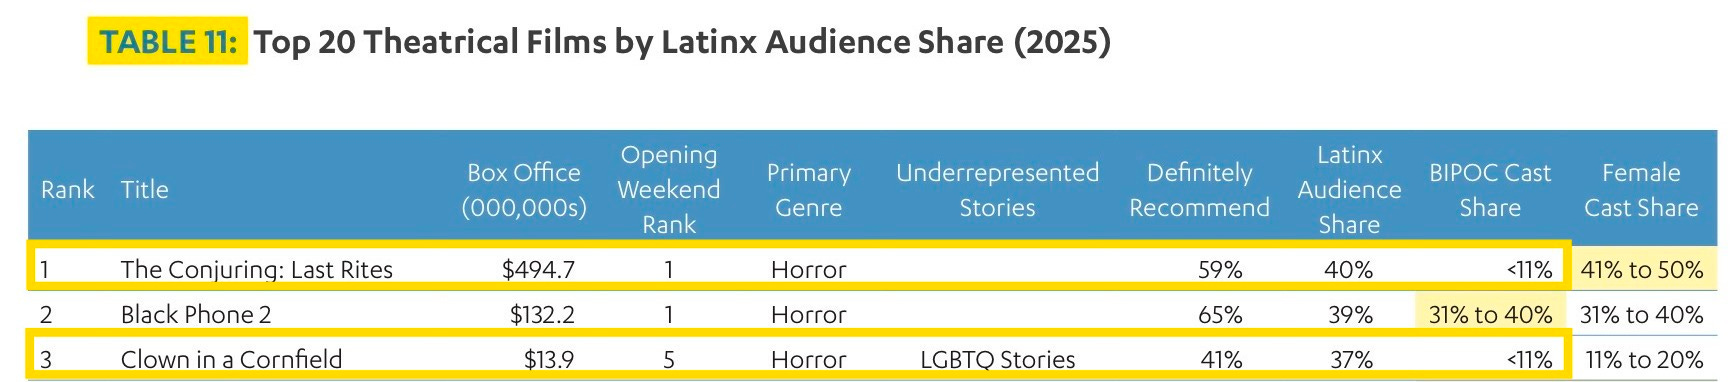
All of these films have white leads, and number one and three also have zero BIPOC leads. This may be why the study chose the “strange range” method to begin with: it’s far less awkward to write <11% BIPOC Cast than, more accurately, zero BIPOC Cast. Note also that they do not break out the “Lead” category in these boxes, possibly for the same reason.

When they say in their headline quote that “America’s increasingly diverse audiences prefer diverse content in theatrical film releases,” they have to mean cast, because they do not provide data on the performance of films with diverse creators behind the camera.
They pull this finding to the top of the study, in huge letters, with almost no evidence. These are not even apples and oranges, they’re apples and orangutans.

So as we’ve seen, this study is cherry-picking at an industrial level to claim three distinct points:
Diverse casts make the most money.
Because diverse audiences prefer them.
We should therefore also have more diversity behind the camera.
The first two rest on a single, strange metric — top-eight billing — and it doesn’t establish either one. The third doesn’t follow from those metrics at all.
UCLA’s counts of directors and screenwriters do show real underrepresentation behind the camera, and that finding stands on its own.
Which is why this spurious logic chain is so self-defeating. The strongest aspect of the report is being tied to the weakest. If the commercial case collapses — and it does — the employment case shouldn’t go down with it. But that’s the strange structure UCLA has built.
None of this means UCLA’s other statistics are wrong. Counting directors, writers, or cast members is a valuable exercise (although as we’ll see, there are flaws here too). The problem is when those are treated as proof that one variable causes another.
Showing that more diverse casts and higher box office sometimes occur together is not the same as showing that one produced the other. It’s a textbook confusion of correlation and causation.
Nowhere does this problem become more obvious than in the films the report chooses as proof.
Many Films They Categorize as Diverse Are a Stretch
On page thirty-nine, the report names its examples: “nineteen films fell into the 41 percent to 50 percent BIPOC cast interval, including Avatar: Fire and Ash ($919.4 million).”

Wait. Ten-foot-tall, mo-cap blue aliens qualify as diverse based on the voice actors? And Zootopia 2 also qualifies, even though it features animated, talking animals?
Whatever audiences are responding to in these films, it’s probably not diversity of the actors’ voices. It took your humble Gadfly twenty minutes of googling to work out which blue actor was which on the Avatar 3 poster.
Important to note: animated foxes and bunnies don’t have a race. But UCLA never explains why performance capture, voice acting and live action should all be treated as equivalent measures of representation.

Also, the actors voicing the true leads in this movie, Jason Bateman and Ginnifer Goodwin, are both white. We do not have their data on the performance of the films with white leads, which is simply left out.
The BIPOC Problem
I’m going to keep this section brief, as I’ve written on this extensively elsewhere, including here and here. The use of the term BIPOC throughout the study is especially self-defeating. This is because the term BIPOC combines populations with dramatically different levels of representation.
As we’ll see, huge disparities are hidden by the BIPOC term, which actually obscures UCLA’s most crucial finding. You can see what I’m talking about here, in their highlight section on page 3:
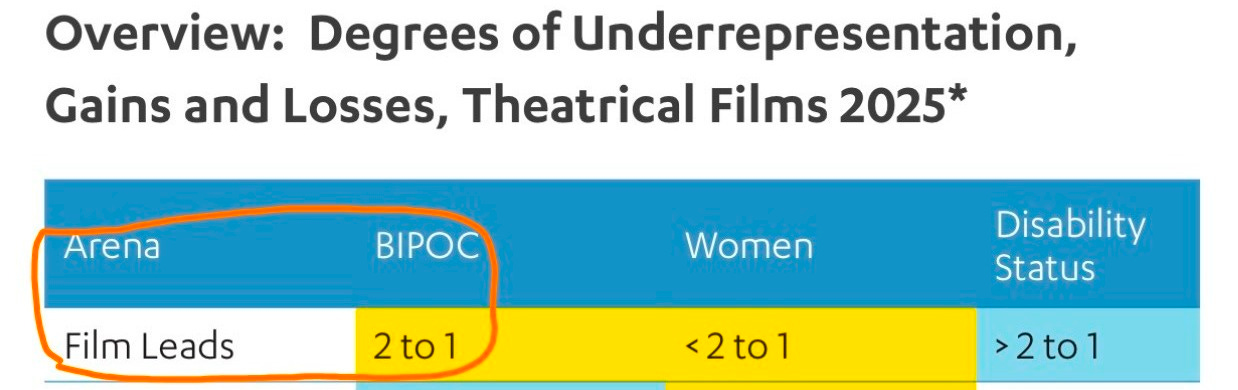
The BIPOC framing makes it look like all leads are underrepresented at an equal rate of 2 to 1. But when they’re broken out (as we saw, however problematically), theatrical leads actually look like this:
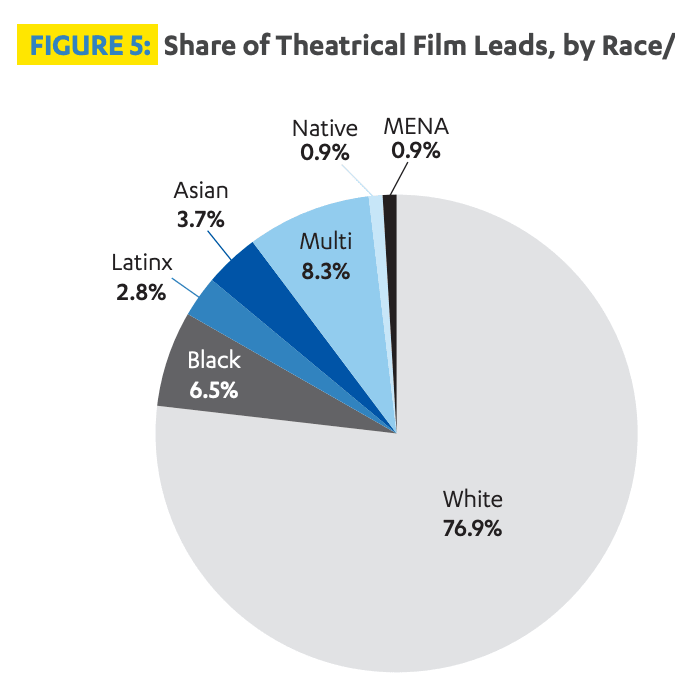
The BIPOC term thus hides a deeply unsettling truth: Latinos are severely underrepresented versus their population size, dramatically more than other groups. This is particularly ironic for a study funded by the Latino Film Institute, which in itself is already a conflict of interest.
Why on earth is this not in the highlights? Why isn’t it plastered on the cover, instead of buried on page 17? It’s probably the single most valuable and important finding in the entire study, at least as far as cast goes. But because of their commitment to BIPOC, it is hidden away much later.
To show how dire Latino underrepresentation really is, if you actually break out the individual groups’ underrepresentation, here’s what you get:
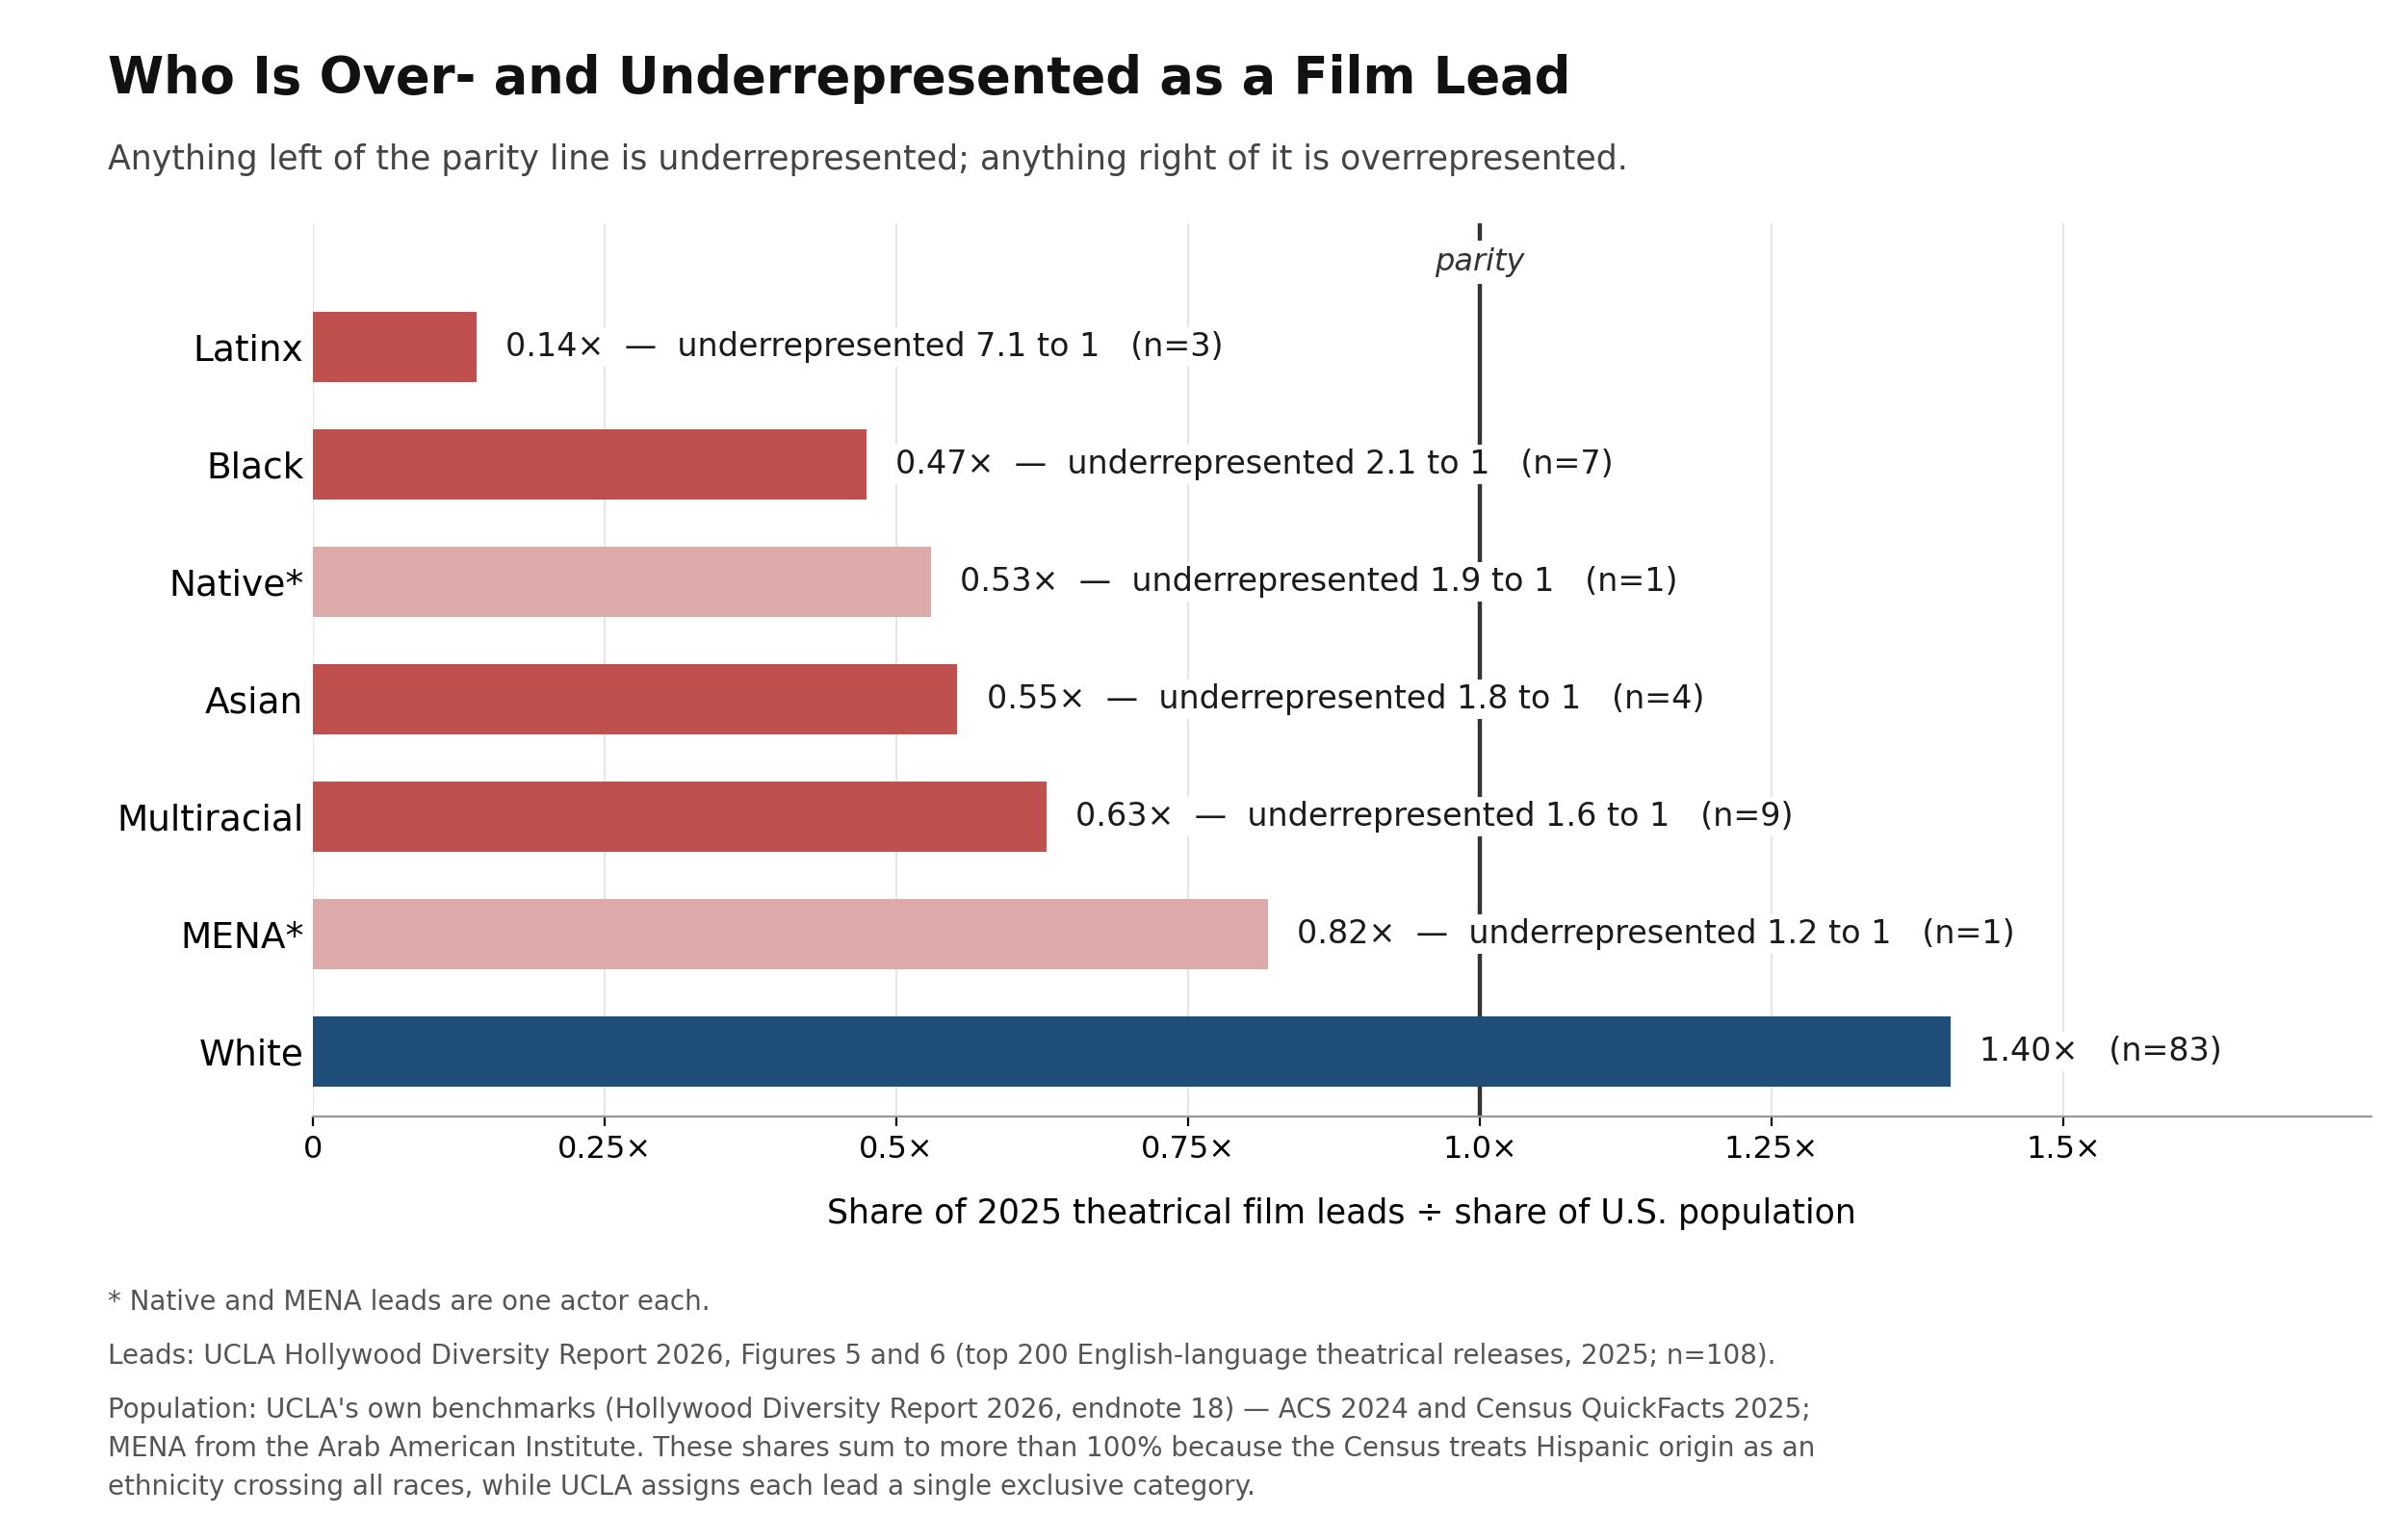
Latinos are underrepresented by a staggering 7:1. This is over 3x the Black group, the next-worst category. But when Latinos are mushed in with everyone else, it brings the overall underrepresentation down to just 2:1.
The study comments on this. It’s the only time it uses the term “egregiously.”

But they’re egregiously underrepresented partially by the study’s own methodology.
Let’s try another experiment. Let’s actually make Zoe Saldaña a Latinx lead, adding just one more Latinx lead to the very small category (just three actors). Doing so increases Latino representation by 33%, and reduces underrepresentation to 5.4 to one, a massive shift. So just one billing-order change cuts the headline Latino finding by almost a quarter.
Here’s how underrepresentation stacks up in their “All Film Roles category” (which again, is actually just the eight top billed actors):
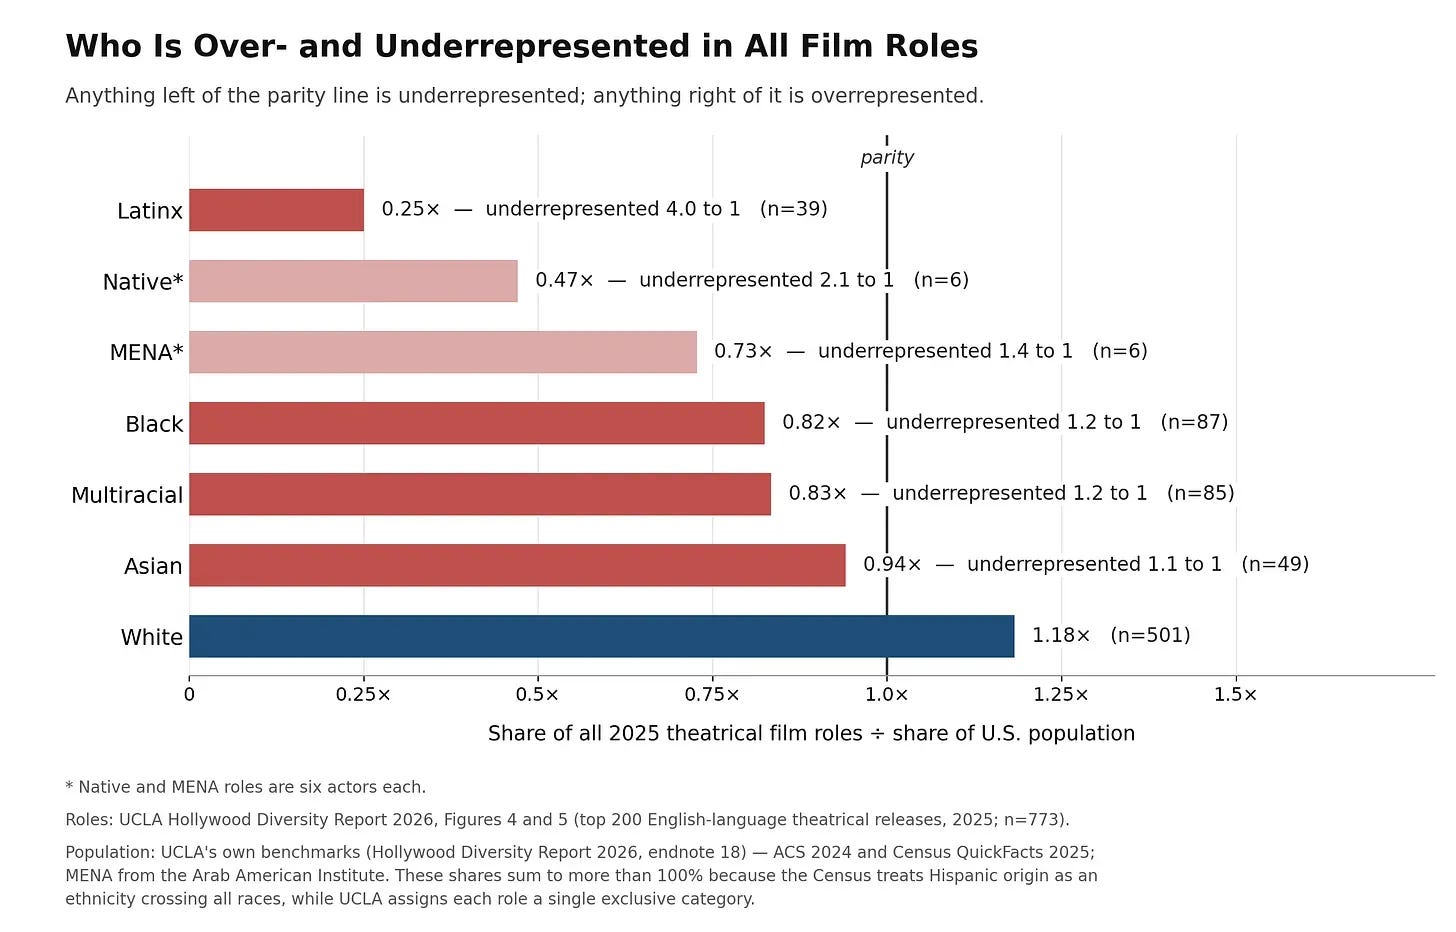
Again, a story of 4:1 Latinx underrepresentation in all roles is thus mushed together with all the other groups to yield a 2:1 average underrepresentation.
But as you can see, there’s also a large cluster of multiracial people, which creates its own problem for this kind of study.
The Zoe Saldaña Problem: Multiracial Actors
The multiracial category seems great in theory, but in practice nobody can be solely multiracial. Like Saldaña, they can only be a combination of actual races: Black/Latino, White/Asian etc.

Zoe Saldaña, of Avatar fame, is multiracial generally, and Afro-Latina specifically, so which box would she slot into?
UCLA never explains how most multiracial performers like Saldaña are allocated across categories. That matters because multiracial performers account for 8.3% of theatrical leads (9 actual roles) — the second-largest category in the chart. If we split them out into actual ethnicities, it would dramatically change their findings.
Depending on the coding rule, representation estimates could change substantially. We could just run the numbers, but again without a published coding protocol or dataset, readers cannot tell how much of the apparent gap reflects actual casting, or simply classification.
Because of this, the number of Latino or Black roles could swing wildly based on whether Saldaña is characterized as Black, Latino or, most accurately, both.
But it gets even stranger: the one specific multiracial subgroup the study uses is Black Latinx, who are reported as only Latinx. Why not Black as well? Is it because the study is funded by the Latino Film Institute?

Zoe Saldaña would thus qualify as Latinx, but not Black.
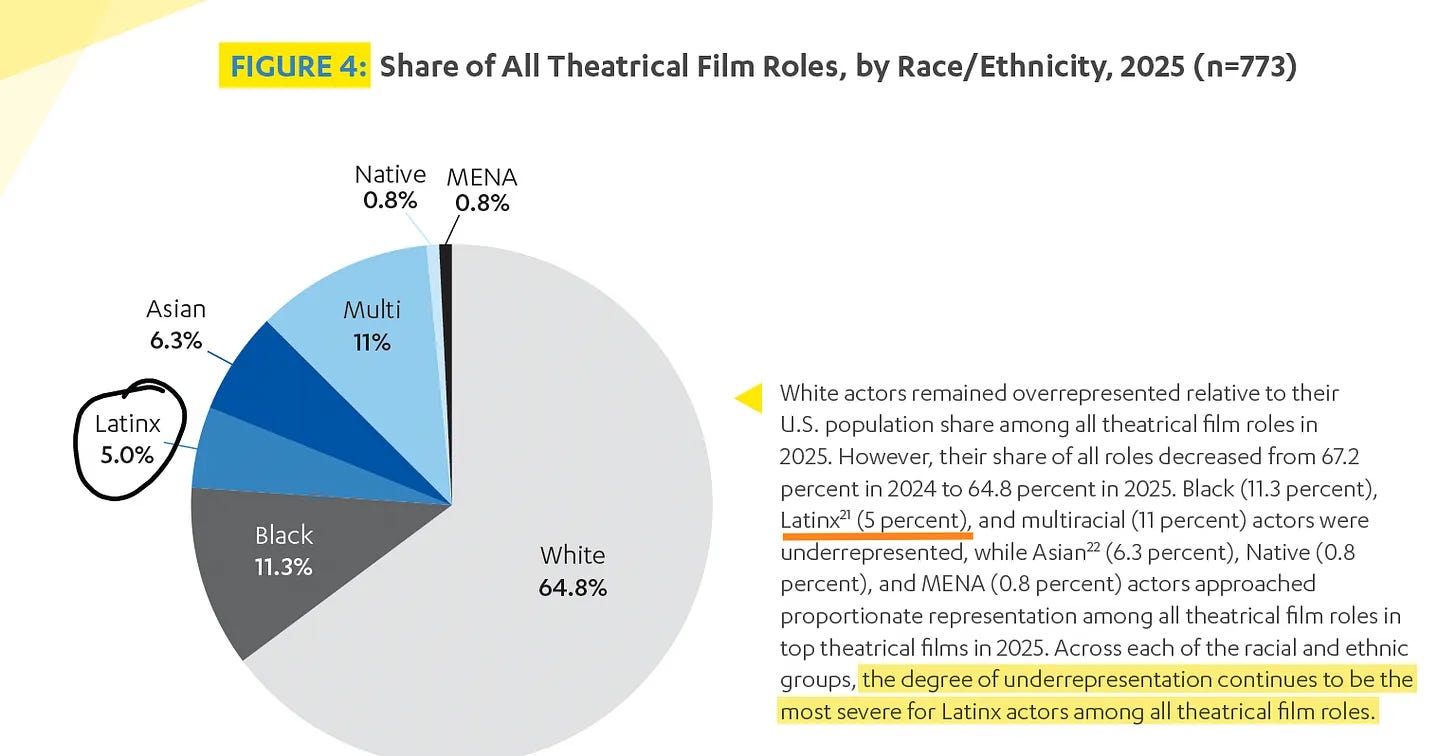
This again is strange. The study’s longest footnote includes a giant taxonomy of races, including thirty-one ways to be MENA and only one way to be multiracial; Black Latinx, in which case, they are categorized Latinx. This added one man and three women to the Latinx category.

And because of these strange practices, their own 45.2% benchmark itself can't even be checked. UCLA states the BIPOC share of the U.S. population as 45.2 percent, but the figures listed in its own endnote 18 — 20 percent Latinx, 13.7 percent Black, 13.2 percent multiracial, 6.7 percent Asian, 1.7 percent Native, 1.1 percent MENA — overlap so heavily that they can't be added, and no consistent reading of them produces 45.2%.
Also, notice how little actual work "alignment" is doing. The bin spans ten percentage points, so whether the true figure is 42.2, 43.6, or their stated 45.2, the "coincidental alignment" holds. But look again at the actual possible values: 0, 12.5, 25, 37.5, 50. No film can have a cast that is exactly 45.2 percent BIPOC, at least while only measuring eight leads. The alignment isn't with any real film — it's with the strange range UCLA invented.
But as we’ll see, even focusing on US ethnic composition is in itself problematic for blockbusters, because of…
The International Problem
The study argues for diversity based on the ethnic composition of the U.S., but never explains why this is the right baseline for a globally distributed product.
This is a problem for UCLA, because the report simultaneously argues films must “travel” internationally, while benchmarking its casting argument against U.S. demographics.
But if Hollywood is selling primarily into global markets, then why should U.S. demographics be the benchmark for commercial success? There may be an argument for that, but they never tell us what it is.
The US and Canada are under 5% of the world's population and a little over a quarter of its box office. This is important because North America isn't a scale model of the global audience, it's one wildly unrepresentative slice of it.
Benchmarking casting against U.S. Census demographics is therefore an argument about domestic demand, but UCLA never says whether that's the argument it's making.
Are Germans really hankering for more American BIPOC actors? We don’t know. Because UCLA presents no evidence for why this should be.
Race is admittedly a murky category, especially when applied to the world. But if we were to collapse it into the categories UCLA uses, minus multiracial, here’s what we get.
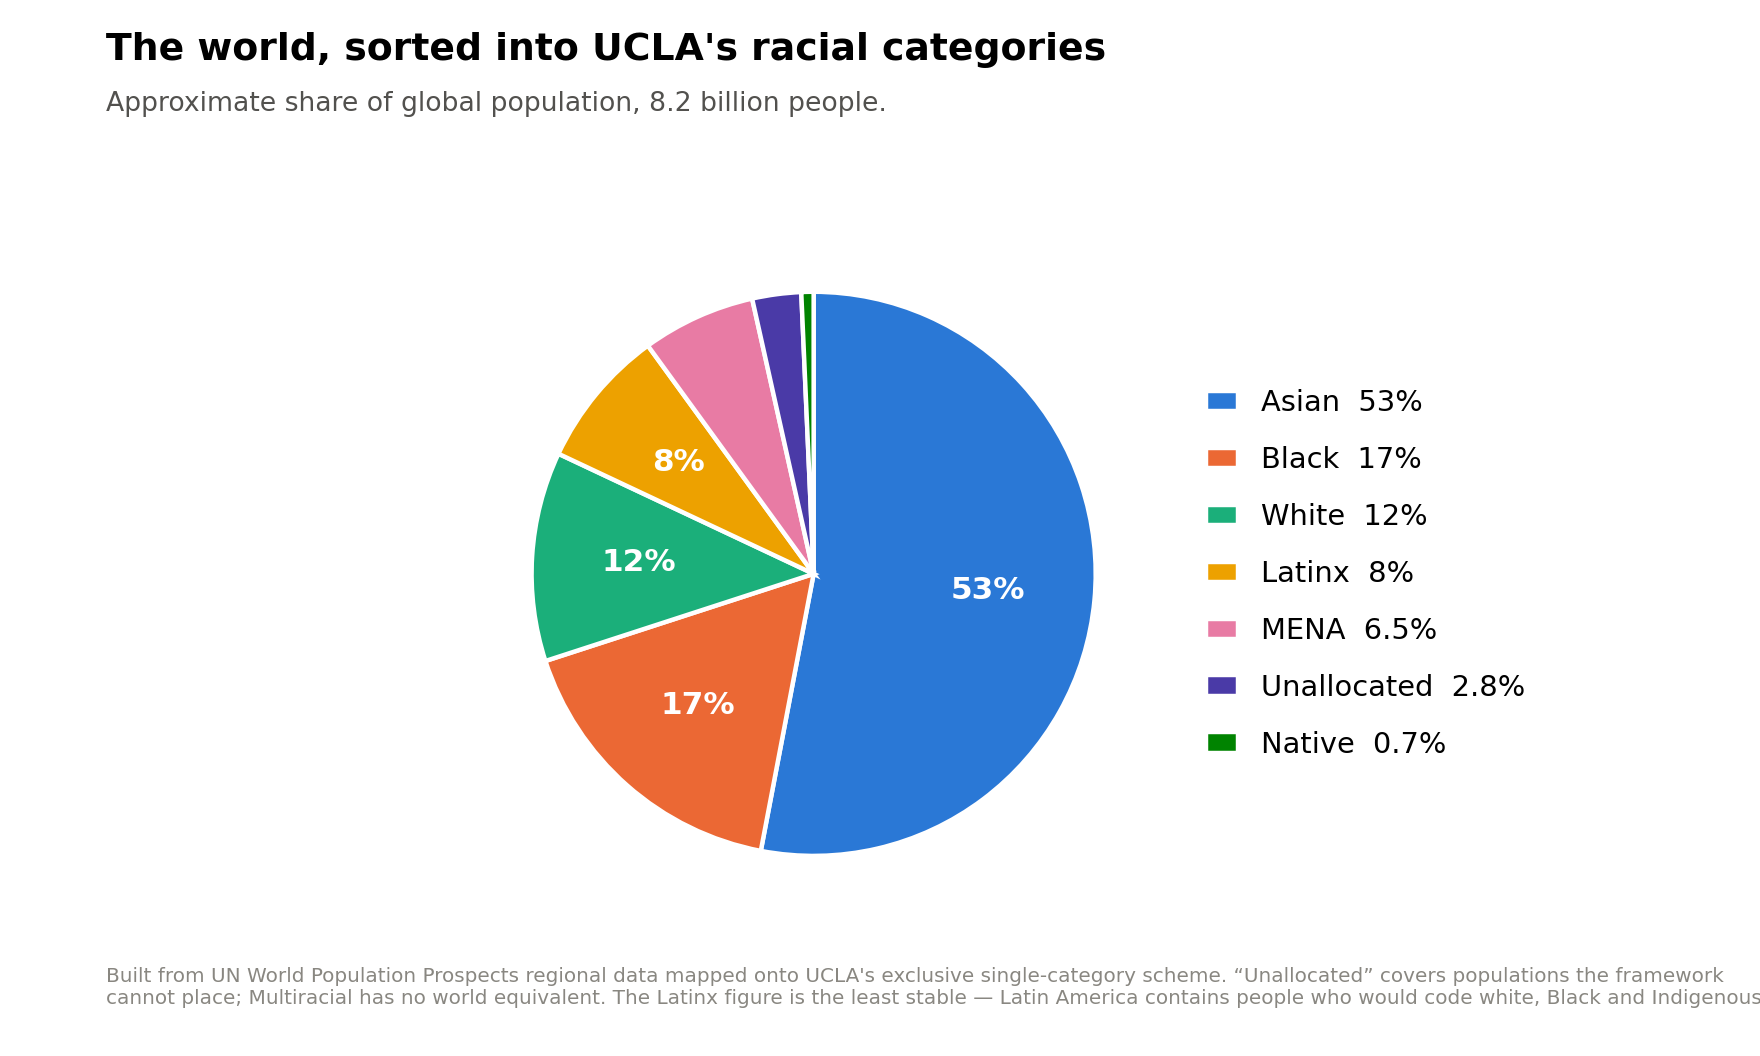
Let’s see how this stacks up against the underrepresentation numbers:
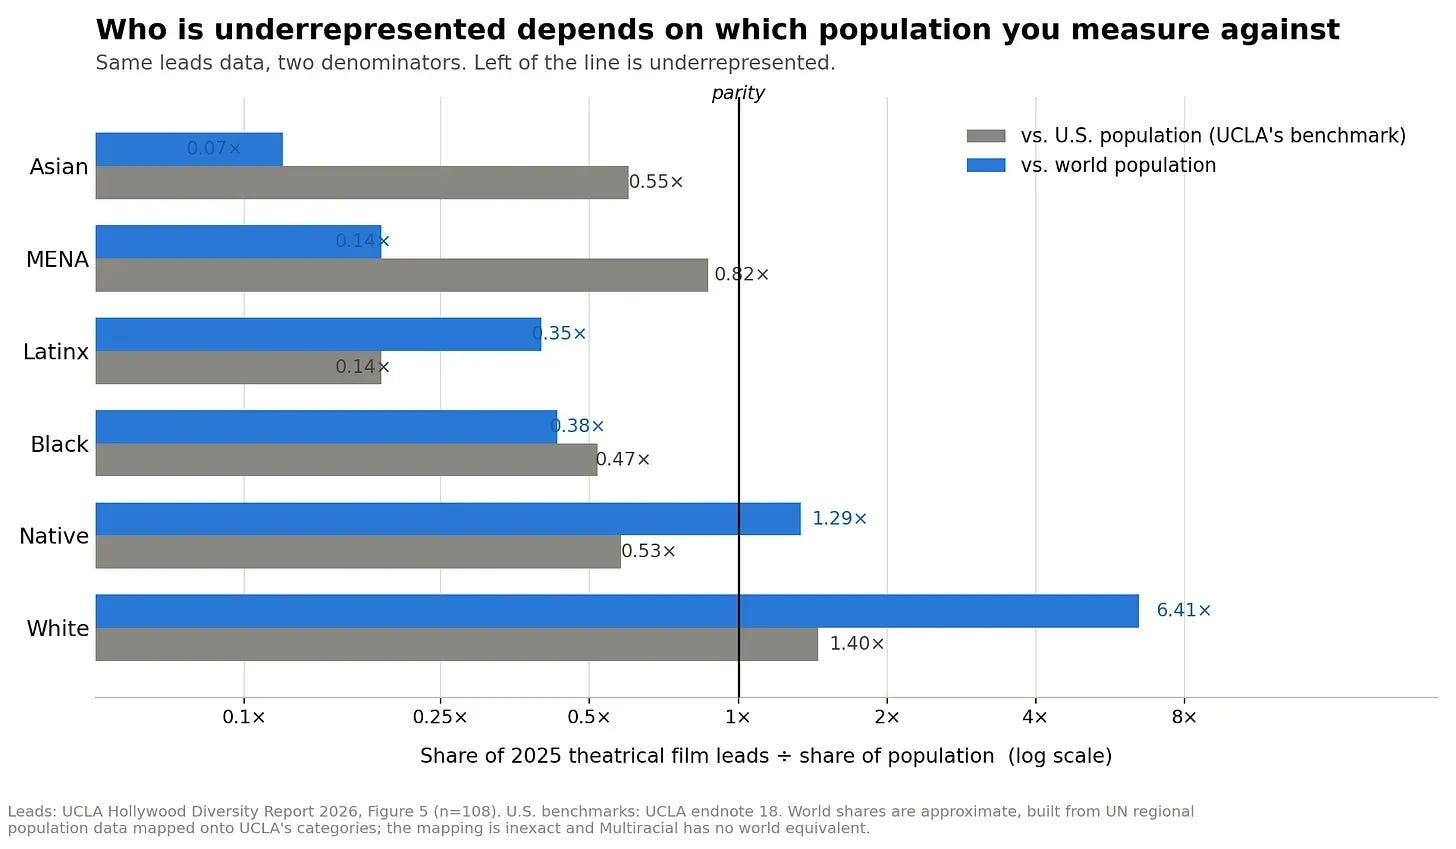
In this version, Asians are massively underrepresented in major motion pictures, while white people are even more massively overrepresented.
One might object that UCLA is studying American employment. That’s cool, just don’t use it as proof of global audience preferences.
And yet again, the study has its cake and eats it too with international films, especially in their “Wake Up Call” section on page 58:
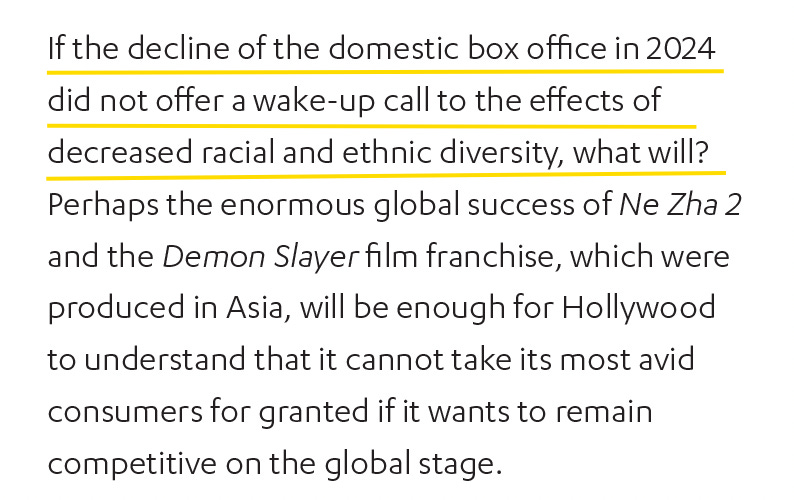
But here’s the problem with this. First of all, there were massive strikes in 2023. The WGA went on strike from May to September 2023. SAG-AFTRA joined them from July to November, halting production for months and gutting the 2024 release calendar. UCLA never mentions this, in a passage that asks what more evidence of diversity’s effects anyone could need.
It’s not like the strikes were some sort of trade secret: they were covered in every major trade publication, including Variety.
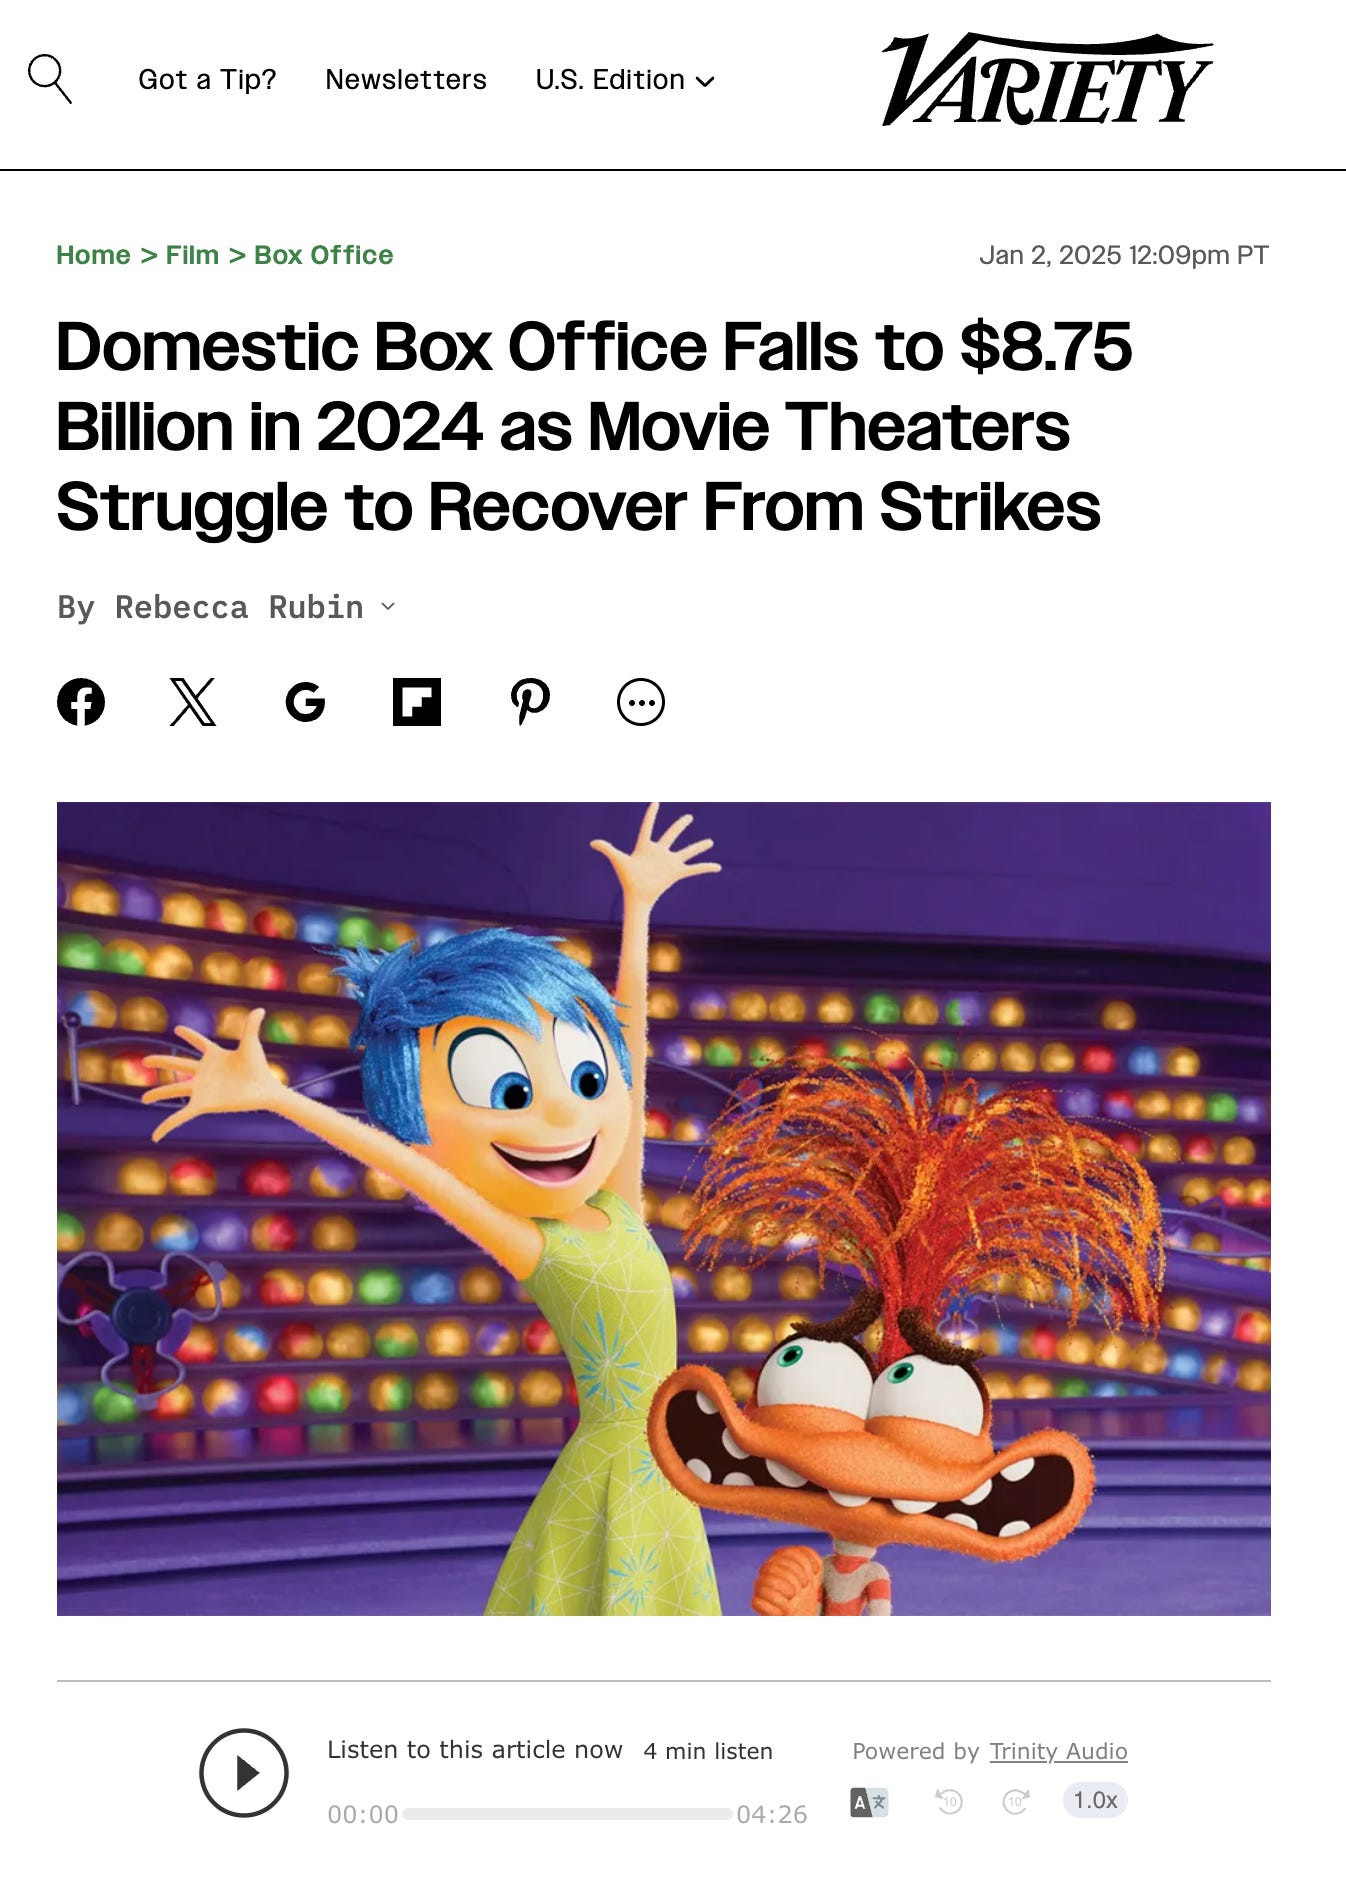
Ne Zha 2 is also not even from 2024. Per Box Office Mojo it’s the number one film of 2025, and the only non-Hollywood production in the 50 highest grossing films of all time. The film also earned 99% of its $2bn in China. It barely went international at all.
If there’s a lesson here, it’s make local films for local audiences — not diversify American blockbuster casts to match the U.S. Census numbers. And notice who “its most avid consumers” turns out to mean: Chinese moviegoers. The study’s actual thesis is about American BIPOC audiences, which somehow, through reasons unknown, are supposed to mirror global audiences.
UCLA’s Own Data Keeps Contradicting Their Own Thesis
Elsewhere this appears:
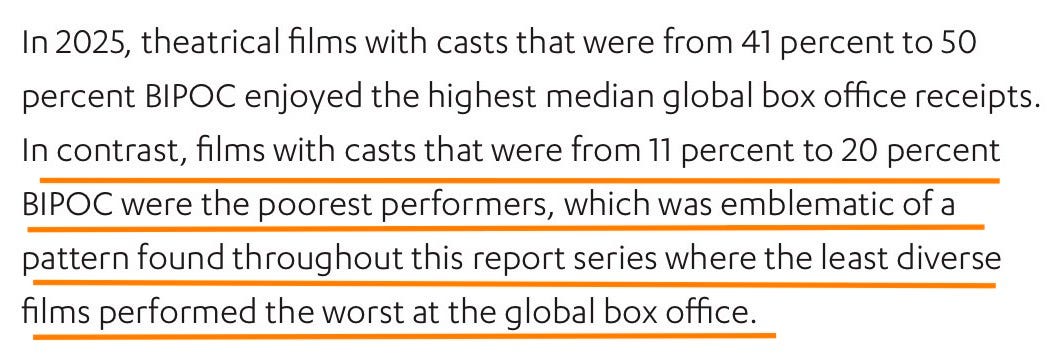
With what we’ve now learned, let’s translate this highly confusing paragraph into plain english:
The most lucrative amount of diversity is 3-4 leads of color. That’s the sweet spot for success. Not more.
The least lucrative amount of diversity is 1 lead of color.
Zero leads of color do better at the box office than 1 lead of color.
In this paragraph UCLA once again contradicts their own thesis about diversity driving box office. They themselves say that their data reveals that the second-least diverse films perform the worst, not the ones with no diversity at all.
What a strange argument for diversity improving the bottom line: adding a single diverse lead actually reduces box office performance.
Even if we put this aside, diversity of cast still doesn’t make sense as a solo metric for success: cast diversity is tangled up with budget, genre, franchise status, ensemble size, and release theaters. The report never disentangles them to prove that diversity is what’s actually causing the success.
Have a look at the median global box office by cast diversity bin, 2025 (Table 3, p. 42):
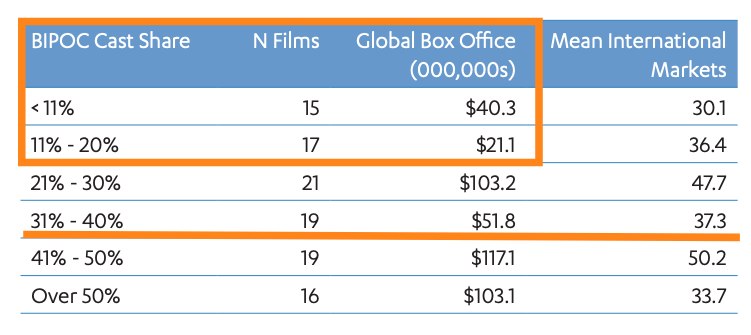
The < 11% films earn almost double those with one lead. Does that mean we should stop casting one diverse lead if we want to make money?
As we continue, the 31–40% bin earns less than half of the bins on either side of it. Does that mean that films with 3 diverse leads are toxic at the box office and should be avoided in favor of two or four?
Finally, the best-performing bin is the second-most-diverse, not the most diverse. The most diverse bin is the over 50% one, in which the number of markets and films, and the box office, all go down. Is this arguing that we should never make films with more than four diverse leads?
How do the most diverse films perform, ones with all BIPOC cast? We don’t know, because all numbers over 50% are sandwiched together.
This is all indicative of randomness and flawed methodology, not any sort of pattern. If diverse leads meant more box office, we would expect to see the numbers trend consistently upwards, not go on a drunkard’s walk, stumbling up and down from one category to the next.

Mo' Theaters, Mo’ Money
Figure 3 also reports another variable that receives almost no discussion: mean theater count. The films in the 41-50% bin opened in roughly 3,460 theaters versus roughly 2,580 for the 11-20% bin.
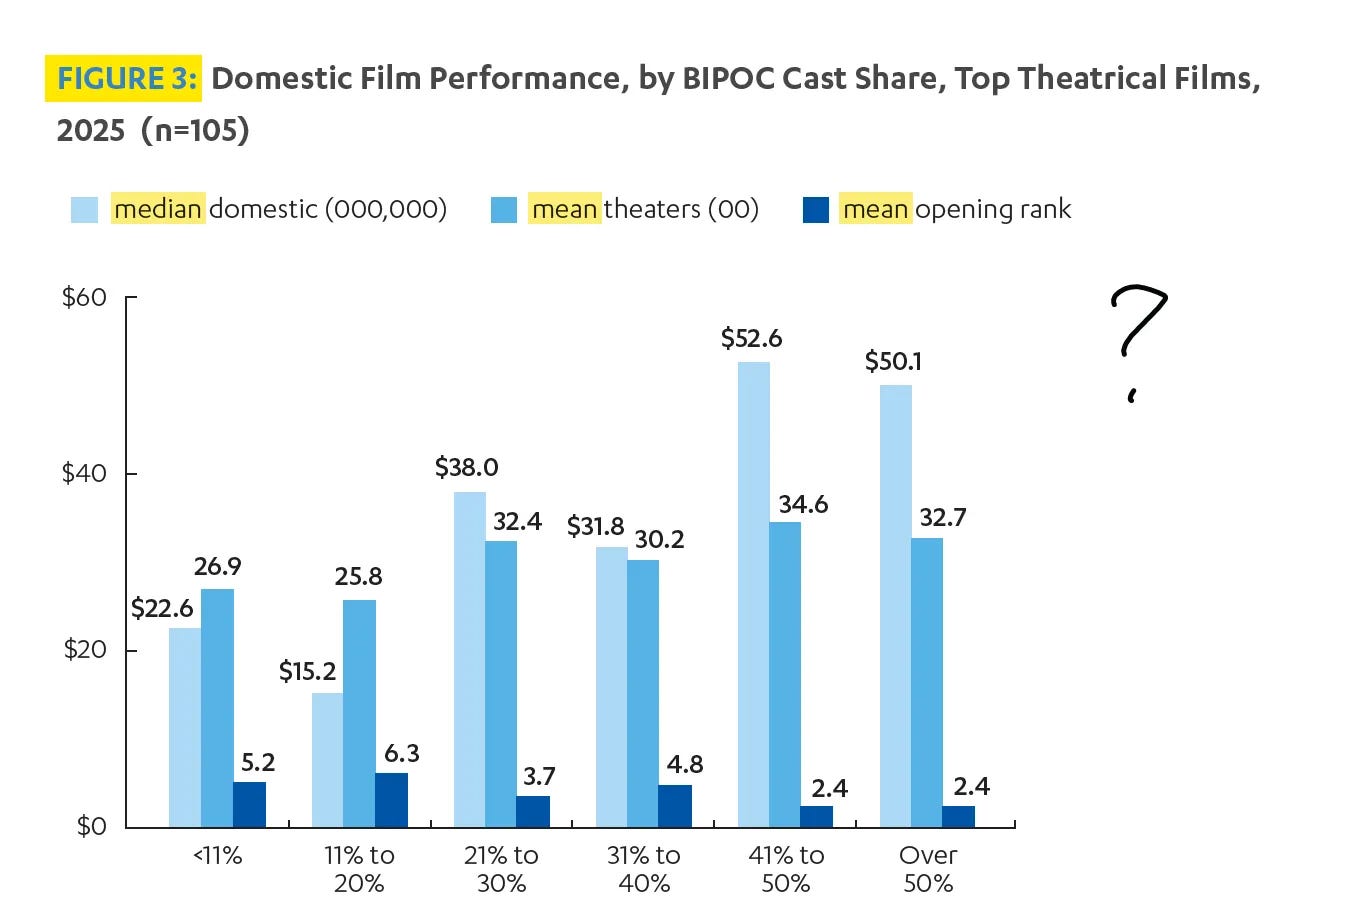
It dips at 11-20%, recovers at 21-30%, then dips again at 31-40%. But every dip in box office is a dip in theater count, in the same place, by the same shape. What looks like noise in the diversity story is actually a clean signal in the distribution story:
mo’ theaters, mo’ money. And of course it is! Theaters are where the money is made.
As I’ve mentioned elsewhere, theater count is determined before audiences buy tickets and reflects distributor confidence and marketing investment. Once that variable enters the picture, the relationship between cast diversity and box office becomes much harder to disentangle.
Having diverse casts thus does not necessarily directly cause a movie to have a bigger budget, release in more theaters, and make more money. It may be the other way around: having bigger budgets that release in more theaters means casts are more likely to be larger and more diverse.
Elsewhere, the report observes that white moviegoers made up the largest audience share for biographies, documentaries and dramas — and that those same three genres posted the lowest median box office.
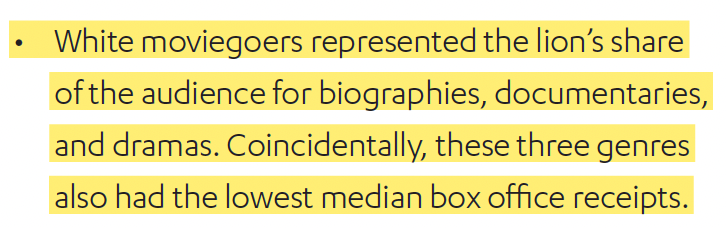
This is the only time in the entire report they use the term “coincidentally.” Everywhere else, two things moving alongside each other is presented as straight evidence. Diverse casts and high box office share a bin, and that “demonstrates” the thesis. White audiences and low box office share three genres, and that’s, coincidentally, worth mentioning.
The hedge is right. Biographies, documentaries and dramas are cheap films that don’t generally open in 3,400 theaters. But does anyone really think cheap documentaries and expensive sci-fi films get the same distribution?
Even worse, it’s the same objection that sinks their cast-diversity finding; correlation is not causation. UCLA sees the confound when it wants to. Just not in the direction that hurts their thesis.
Table 5 is a Mess
Remember the horror problem from the top of this piece? Here’s where it lives:
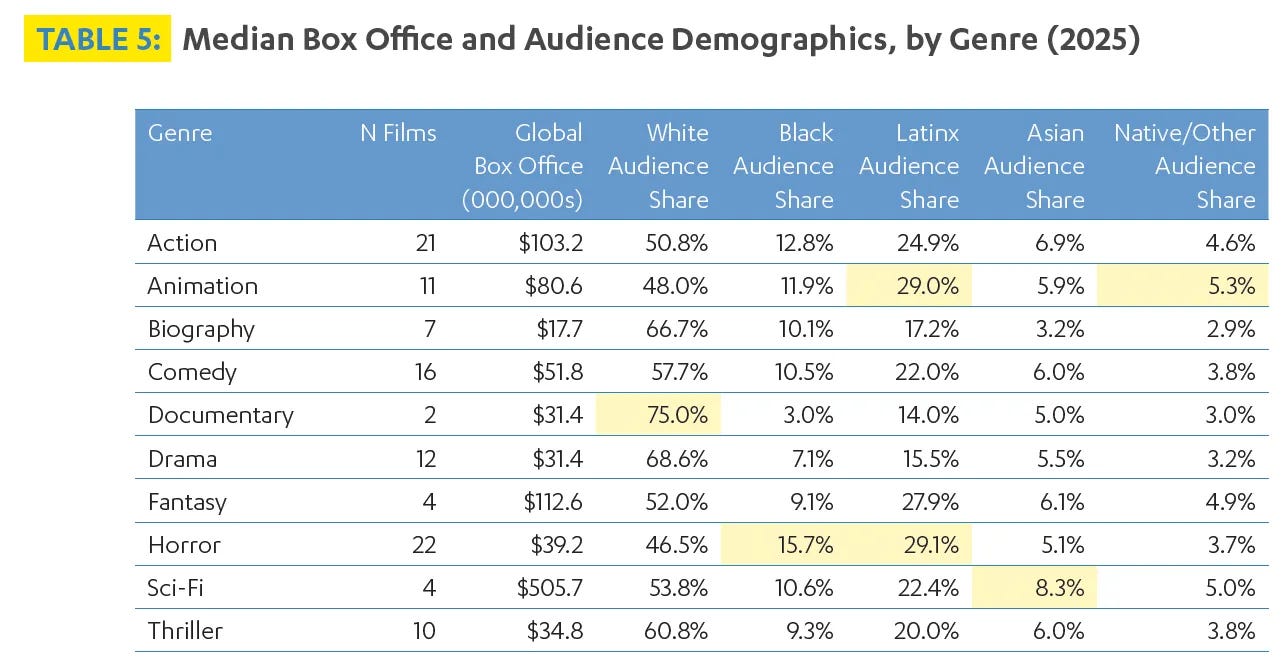
Table 5 (p. 43) reports median global box office and audience demographics across ten genres. This undermines the report’s thesis in multiple ways.
First, the horror paradox. Horror draws the highest Black and Latinx audience share of any genre (15.7% and 29.1%), and posts the lowest white share (46.5%). Per Table 1, it also has the highest ROI in the study, at 2.6. And per Figure 2, 63.6% of horror films fall at or below the 30% BIPOC cast threshold — the third-worst share of any genre, after fantasy and drama.
So the audiences UCLA says are least represented on screen turn out most heavily for one of the genres that casts them least — and that genre returns more per dollar than any other in the study. This finding is never discussed, but it could point to an obvious conclusion: Black and Latino audiences care more about genre than cast diversity.

But it gets stranger. The genre with almost exactly the same Latinx audience share is animation, at 29.0% against horror’s 29.1% — UCLA highlights both in yellow. Yet animation sits near the top of their cast-diversity ranking while horror sits near the bottom. Two genres at opposite ends of the diversity scale, drawing an identical Latino audience.
And animation’s diversity score comes from voice casting. So the genre that ties horror on Latino turnout only registers as diverse because of who voices the talking animals — which I spent half a section arguing tells you nothing about audience preference for on-screen diversity. Foxes and bunnies don't have a race, but they apparently have a BIPOC cast share.
Second, look at the sample sizes. Documentary: two films. Sci-Fi: four. Fantasy: four. Horror has twenty-two, more than these other three genres combined. The table presents all ten in identical rows conveying identical authority.
The report also prints a median for just two documentary films, then labels it the top white genre. And Sci-Fi’s $505.7M — the largest figure in the table by a factor of four and a half, has just four titles.
Also, why are we even including documentaries alongside fiction films? Documentaries don’t “cast” actors in the same way, they use real people.
Finally, the Zoe Saldaña problem also applies to genres. The N column sums to 109 — every film in the study, each assigned to exactly one genre. But films are rarely one genre.
Sinners’ own IMDb page classifies it as horror and a period drama. The Conjuring: Last Rites’ IMDb page categorizes it as horror, mystery and thriller. Where does a horror-comedy go? A sci-fi action film? The report never says how genre was assigned, by whom, or what happens to a mixed-genre film.
Robustness
So what would a good study look like? Good social science asks whether the results would survive reasonable alternative theories, and which metrics could actually falsify a thesis.
In UCLA’s case, we would want to know if the findings would change if the correlation between diversity and box office were measured using…
screen time?
dialogue?
top five billed actors instead of top eight?
all speaking roles?
weighted billing?
audience surveys?
If audiences truly preferred more diverse casts, we should expect that relationship to survive alternative definitions of diversity, remain after controlling for budget, genre, franchise status, theater count, and marketing, and also appear consistently across years rather than shifting between arbitrary bins.
UCLA never demonstrates any of those things.
Again, there is no published dataset. Race, gender, disability, genre and “underrepresented stories” are all human-coded, by coders not blind to the hypothesis.
The real bottom line is: the study simply doesn’t prove what it says it’s proving. It’s bad science and it’s unfair to diverse people.
A Spiky Academic Jargon Fence
So why do so few people read this study, yet so many cite it?
Like Annenberg, the actual meat and potatoes findings are shielded by a sea of incomprehensible academic jargon, particularly on page 4, which is crammed with findings so abstruse they would make Judith Butler blush.

The last page of headline findings is packed with gems like this one:
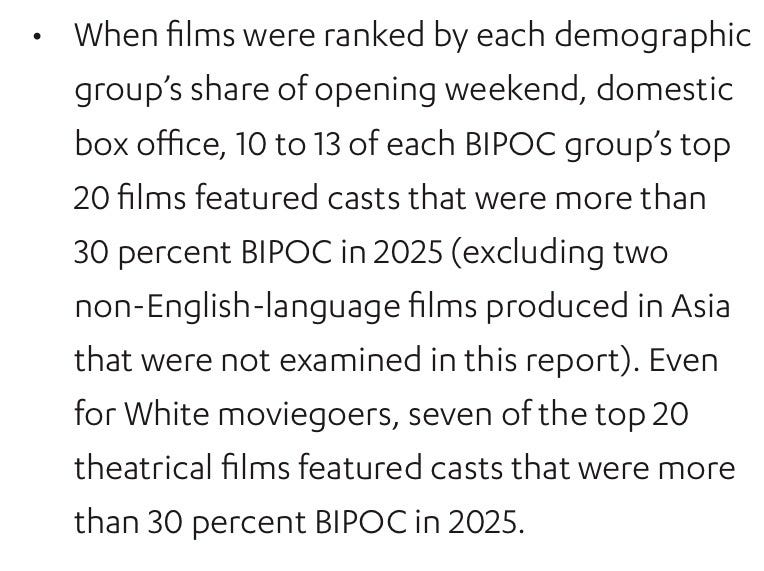
Nine people worked on this. I challenge you to make any real meaning out of it. I’ve read it dozens of times now and still don’t really know what it means.
Page 4 is covered in “Highlights” like these, which serve as a spiky jargon fence to ward off general readers, journalists and, probably, everyone else except for your humble Gadfly.
But, frankly, with such a poor underlying methodology, much of this is just dense, fashionable nonsense, a term coined by Alan Sokal and Jean Bricmont to define the uncritical use of pretentious scientific or mathematical jargon to give philosophical weight to the humanities and social sciences.

Unfortunately, the UCLA Report is just a diversity hypothesis, dressed up in fashionable nonsense, posing as a rigorous academic study.
One Final Issue
Looking back through previous years’ studies, UCLA simply repeats the same headline claim over and over, strengthening the language every year as the “new” evidence deteriorates.
2025: “further demonstrates”
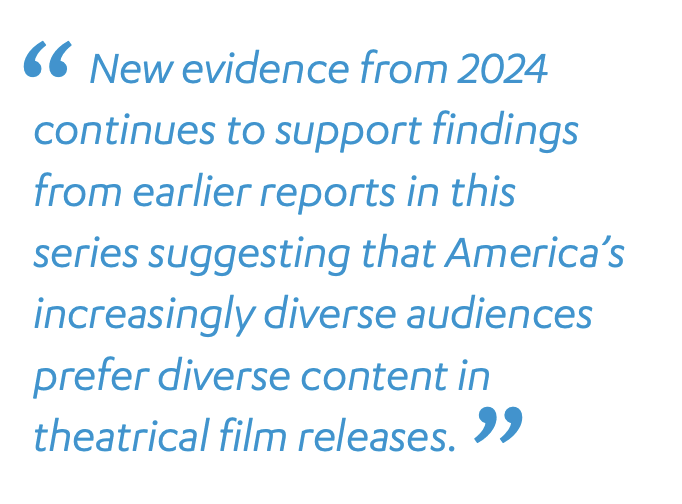
2024: “continues to support”
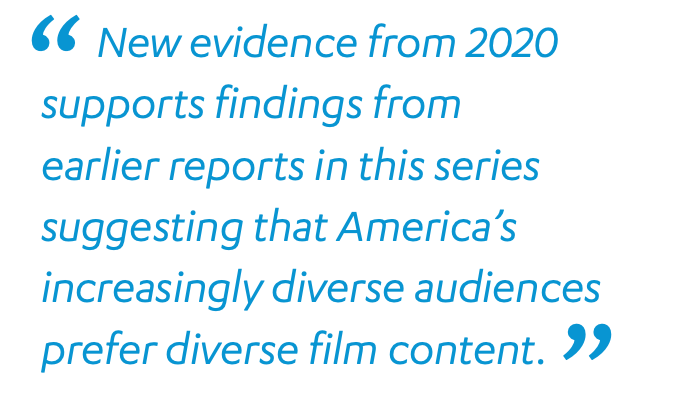
2020: “supports”
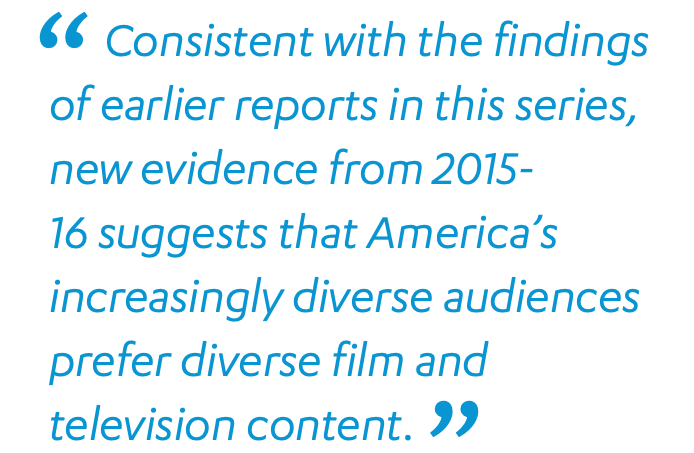
2016: “suggests.”
It seems like, instead of fixing their methodology, they simply updated the strength of their conviction.
What USC and UCLA’s Studies Both Get Wrong
As promised, UCLA also shares many flaws with USC’s study. Here is a quick summary of the main flaws the two studies share:
By focusing on the top 100 films, the studies implicitly assume that blockbuster directing is the highest order of filmmaking success, and equally desirable to all filmmakers. They conflate representation in elite studio tentpoles with representation in filmmaking generally, without proving that equal numbers of people from underrepresented groups are pursuing them.
The reports measure demographic outcomes, but repeatedly interpret them as evidence about opportunity, discrimination, and audience demand without establishing the causal links required to support those conclusions.
The studies confuse noise for signal, using tiny sample sizes that create dramatic-looking swings. UCLA announces diverse candidates “lost ground” in 2025, but the numbers are so small that a swing tells you almost nothing. If there are 8 diverse films one year, and 10 the next, that’s noise, not a trend.
The studies confuse stock and flow. The population of top-grossing directors is a stock — a standing pool of incumbents who sit on their thrones for decades. The directors newly entering that first time blockbuster tier each year are the flow — and in an industry this competitive, the flow is a trickle.

The report examines the top-grossing theatrical films of a single year (2025). But directors, writers and actors are hired years before release. A director appearing in 2025 may have been hired in 2022 or even earlier. We thus can’t reliably use the current year as a metric of progress.

For more on Annenberg’s issues, you can read my piece The Annenberg Ouroboros.

Diversity Deserves Better
The central irony of the UCLA Hollywood Diversity Report is that it asks two important questions:
How diverse are the casts of the world’s top films?
Do diverse films outperform at the box office?
It then designs tools that are far too blunt to answer them.
As the UCLA Report has become one of the industry’s most cited pieces of research, a critique of its methodology and findings is essential.
If UCLA’s choices are arbitrary, insufficiently justified, and unable to distinguish correlation from causation, then the report risks creating confidence where there should be none. And that does a disservice to diverse creatives.
This study has received $1.75 million in government funding. That grant money could have gone to better scholarship. Period.
The case for diversity will not advance until we have better studies and data supporting it. And studies this bad reflect poorly on Hollywood diversity research in general.
If the goal is to persuade Hollywood to change, we need to understand how and why far better than these broken studies allow us to.
In the interest of doing that, and creating something constructive, I have asked Stephen Follows to conduct a follow up study of what the data actually supports in terms of diversity and the box office. I will link to his piece here when he releases it.
I enjoyed this - thanks. It's yet another data point related to the challenges in studying culture. Culture matters and when something matters poltics is inevitable. And when things get political the neutral researcher is history and trust breaks down.
Here’s what’s going on from from someone in the community: For the last 5 years, Gen Z Latinos have complained about how cheesy Latino centered screenplays are (unbeknownst to them, most of these are written by Latino elites of color or white Latinos AND are being butchered by non Latino producers so that they’re understood by all races.) There’s been many viral tik toks about the ways “Latino characters speak on Netflix shows and movies.”
Let’s compare with Tik Tok viewership. Latino tik tok creators get millions of views from Latino viewers because they reflect low income Latino / non elite Latino ways of speaking — @crystalactic is the fastest growing Latina creator right now. She’s low income and clearly not a white or elite Latina. You can also request a tik tok creator for a change, and you’ll see it immediately, but Hollywood producers take eons to change.
Similarly, Latinos listen to Latin musicians — bad bunny was not born an elite, for example. Creating music and tik toks has a lower barrier for entry for low income Latinos than making films.
If Hollywood keeps hiring only white Latino writers or elite Latinos of color who butcher our stories or write Latino stories for white audiences, then Latino audiences will continue to not prioritize them. Even West Side Story which tried to fix the casting was still ultimately swag-less in Spielberg’s hands IMO. No one in my Latino family cared to go watch it.
Edit: some things for readability.